Canada's industry map: oil & gas, healthcare and public-admin towns
Wood Buffalo led Canadian places of 50,000 or more: 29.6% of the labour force worked in mining, quarrying, and oil and gas extraction. Thunder Bay led health care and social assistance, at 20.0%. Gatineau led public administration, at 26.2%. Canada was 1.2%, 12.7%, and 6.2%.
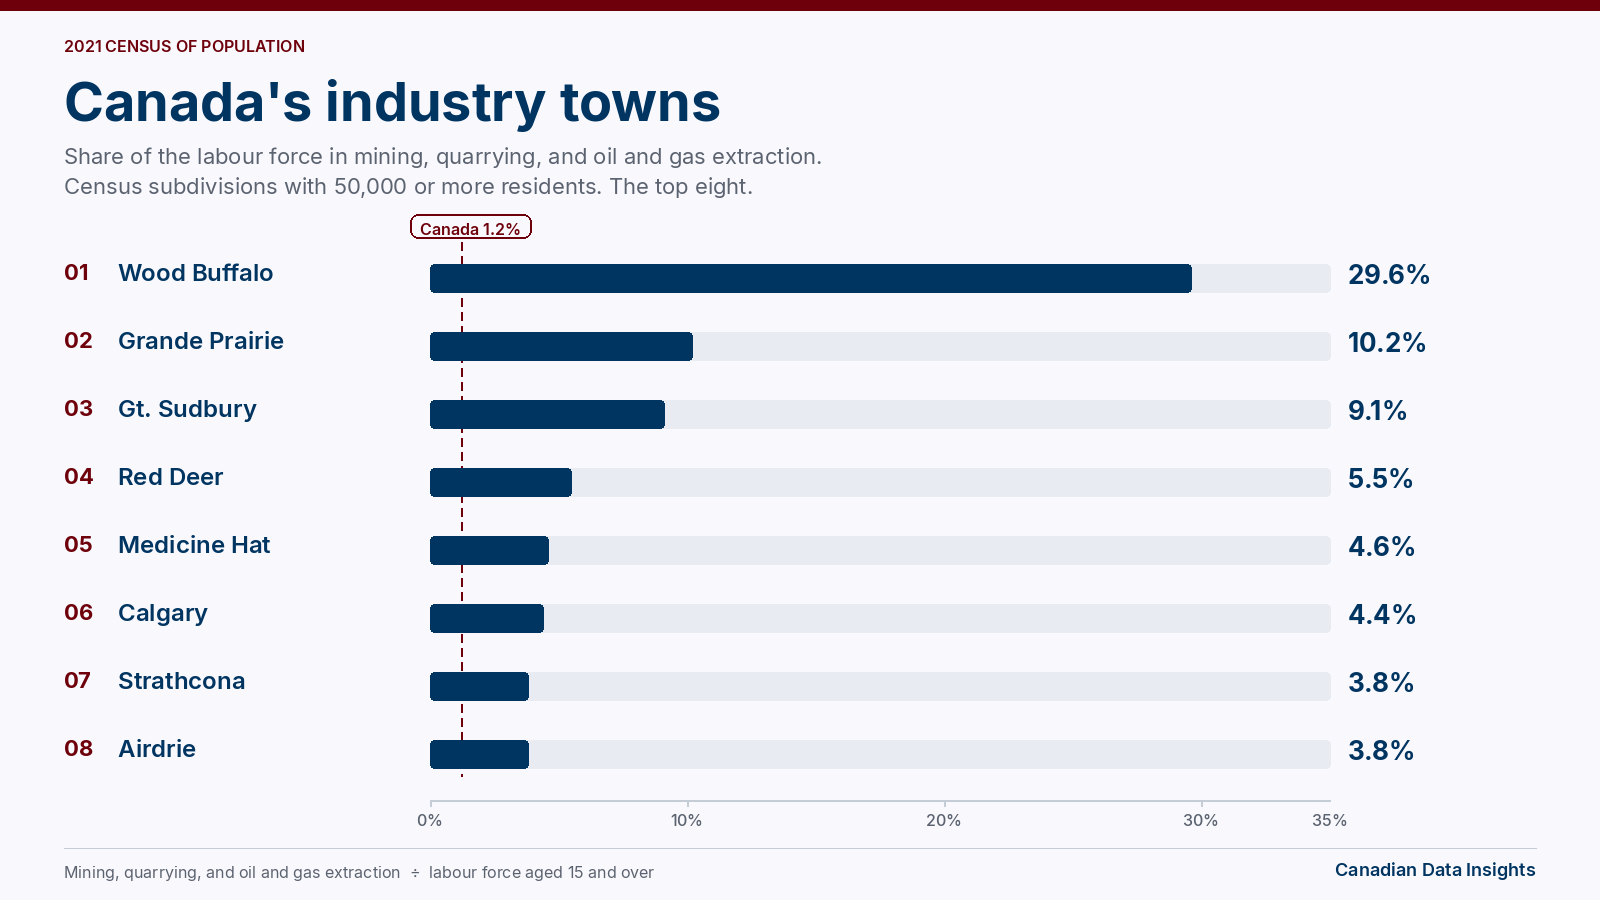
In the 2021 Census, 29.6% of Wood Buffalo's labour force worked in mining, quarrying, and oil and gas extraction — the highest share among Canada's 101 census subdivisions with 50,000 or more residents. Grande Prairie was next, at 10.2%. Across Canada, the same share was 1.2%.
Two other rankings use the same labour-force total. Thunder Bay led health care and social assistance, at 20.0%. Canada's share was 12.7%. Gatineau led public administration, at 26.2%. Canada's share was 6.2%. Ottawa was second on that list, at 21.1%, and has the largest public-administration count in the group of 101. A separate list further down covers places of 10,000 to 49,999. None of those smaller places rank above Wood Buffalo on mining, oil and gas. Fourteen rank above Thunder Bay on health care. Three rank above Gatineau on public administration.
The percentage is the published count for that industry, divided by the published labour-force total. On this site that total is the labour force aged 15 and over. It is the same calculation as the industry section on each location page. The census gives each person one industry, the North American Industry Classification System (NAICS) sector of their job. These shares describe the labour force living in the place. They are not a count of workplaces located there.
Mining, quarrying, and oil and gas extraction is one sector. The file does not split oil and gas from mining or quarrying. Health care and social assistance is one sector. The file does not split hospitals and clinics from social assistance. Public administration is one sector. This file does not split federal, provincial, territorial, local, or defence employment into separate columns.
The industry categories do not add up to that labour-force total. Statistics Canada randomly rounds census counts, and people with no classified industry stay in the published total. This page does not estimate that remainder, and it does not adjust for rounding.
This is a different ranking from Canada's trades-heavy towns and from bachelor's vs trades. The trades-towns post counts an occupation, as a share of the same labour force. The education post counts credentials, as a share of everyone aged 15 and over. Worked at home is a share of the employed labour force. Wood Buffalo led the occupation list, at 31.3% (13,345 of 42,655). It leads this mining list as well.
Places of 50,000 or more: mining, quarrying, and oil and gas
The ranking below keeps the list to census subdivisions — cities, towns, and other municipalities — with a 2021 population of at least 50,000. That threshold leaves 101 places. Every figure is calculated from the census counts in this site's location file. Nine of the top 15 are in Alberta. Three are in Ontario, and one each in British Columbia, Newfoundland and Labrador, and Saskatchewan.
Calgary does not lead the share. It has the largest count in this sector in the group of 101: 32,410 people.
| Rank | Place | Province | Population | Mining, quarrying, and oil and gas | Labour force | Share |
|---|---|---|---|---|---|---|
| 1 | Wood Buffalo | Alberta | 72,326 | 12,625 | 42,655 | 29.6% |
| 2 | Grande Prairie | Alberta | 64,141 | 3,750 | 36,645 | 10.2% |
| 3 | Greater Sudbury | Ontario | 166,004 | 7,620 | 84,000 | 9.1% |
| 4 | Red Deer | Alberta | 100,844 | 2,940 | 53,415 | 5.5% |
| 5 | Medicine Hat | Alberta | 63,271 | 1,445 | 31,715 | 4.6% |
| 6 | Calgary | Alberta | 1,306,784 | 32,410 | 730,050 | 4.4% |
| 7 | Strathcona County | Alberta | 99,225 | 2,090 | 54,405 | 3.8% |
| 8 | Airdrie | Alberta | 74,100 | 1,560 | 41,335 | 3.8% |
| 9 | Kamloops | British Columbia | 97,902 | 1,575 | 51,030 | 3.1% |
| 10 | North Bay | Ontario | 52,662 | 640 | 25,420 | 2.5% |
| 11 | St. John's | Newfoundland and Labrador | 110,525 | 1,210 | 57,380 | 2.1% |
| 12 | Saskatoon | Saskatchewan | 266,141 | 2,975 | 144,115 | 2.1% |
| 13 | St. Albert | Alberta | 68,232 | 725 | 36,040 | 2.0% |
| 14 | Edmonton | Alberta | 1,010,899 | 10,225 | 554,040 | 1.8% |
| 15 | Thunder Bay | Ontario | 108,843 | 780 | 53,350 | 1.5% |
Shares are shown to one decimal place, matching the location pages. Strathcona County (2,090 of 54,405) ranks just ahead of Airdrie (1,560 of 41,335), and St. John's (1,210 of 57,380) just ahead of Saskatoon (2,975 of 144,115), on the unrounded share. Both pairs round to the same tenth, 3.8% and 2.1%.
Greater Sudbury in this table is the census subdivision named Greater Sudbury / Grand Sudbury, population 166,004. It is 3rd, at 9.1% (7,620 of 84,000). A high share here is the whole sector, mining and quarrying included. The file does not say how much of that 7,620 is oil and gas.
Three more places round above Canada's 1.2% and sit just outside the table. Cape Breton is 16th, at 1.4% (570 of 41,585). Lethbridge is 17th, at 1.3% (685 of 51,775). Sarnia is 18th, at 1.3% (425 of 33,035). Lethbridge ranks just ahead of Sarnia on the unrounded share.
Wood Buffalo, first on this list, is last on health care among the same 101 places, at 6.6% (2,815 of 42,655).
Health care and social assistance
The same 101 places, ranked on health care and social assistance. Five of the top 15 are in Ontario. Four are in Quebec, two in Alberta, and one each in Nova Scotia, Manitoba, New Brunswick, and British Columbia.
Toronto does not lead the share. It has the largest health-care count in the group of 101: 163,465 people.
| Rank | Place | Province | Population | Health care and social assistance | Labour force | Share |
|---|---|---|---|---|---|---|
| 1 | Thunder Bay | Ontario | 108,843 | 10,685 | 53,350 | 20.0% |
| 2 | Cape Breton | Nova Scotia | 93,694 | 8,125 | 41,585 | 19.5% |
| 3 | Sherbrooke | Quebec | 172,950 | 16,415 | 89,165 | 18.4% |
| 4 | Trois-Rivières | Quebec | 139,163 | 12,085 | 67,075 | 18.0% |
| 5 | North Bay | Ontario | 52,662 | 4,515 | 25,420 | 17.8% |
| 6 | Peterborough | Ontario | 83,651 | 7,005 | 39,850 | 17.6% |
| 7 | Sault Ste. Marie | Ontario | 72,051 | 5,835 | 33,215 | 17.6% |
| 8 | Brandon | Manitoba | 51,313 | 4,725 | 27,405 | 17.2% |
| 9 | Kingston | Ontario | 132,485 | 11,520 | 66,980 | 17.2% |
| 10 | Lethbridge | Alberta | 98,406 | 8,650 | 51,775 | 16.7% |
| 11 | Repentigny | Quebec | 86,100 | 7,375 | 44,715 | 16.5% |
| 12 | Saint John | New Brunswick | 69,895 | 5,720 | 35,225 | 16.2% |
| 13 | Saguenay | Quebec | 144,723 | 11,620 | 71,660 | 16.2% |
| 14 | Nanaimo | British Columbia | 99,863 | 8,060 | 49,975 | 16.1% |
| 15 | Red Deer | Alberta | 100,844 | 8,495 | 53,415 | 15.9% |
Peterborough (7,005 of 39,850) ranks just ahead of Sault Ste. Marie (5,835 of 33,215). Both round to 17.6%. Brandon (4,725 of 27,405) ranks just ahead of Kingston (11,520 of 66,980). Both round to 17.2%. Saint John (5,720 of 35,225) ranks just ahead of Saguenay (11,620 of 71,660). Both round to 16.2%.
Cape Breton in this table is the regional municipality, population 93,694. Thunder Bay, first here, is 15th on mining, at 1.5% (780 of 53,350), and 18th on public administration, at 7.2% (3,865 of 53,350).
Public administration
The same 101 places, ranked on public administration. Four of the top 15 are in Ontario. Three are in Quebec, two in British Columbia, two in Nova Scotia, and one each in New Brunswick, Newfoundland and Labrador, Alberta, and Saskatchewan.
Ottawa does not lead the share. It has the largest public-administration count in the group of 101: 116,235 people. The paired write-up of the top two places is Ottawa vs Gatineau.
| Rank | Place | Province | Population | Public administration | Labour force | Share |
|---|---|---|---|---|---|---|
| 1 | Gatineau | Quebec | 291,041 | 40,725 | 155,315 | 26.2% |
| 2 | Ottawa | Ontario | 1,017,449 | 116,235 | 549,985 | 21.1% |
| 3 | Québec | Quebec | 549,459 | 39,380 | 293,660 | 13.4% |
| 4 | Victoria | British Columbia | 91,867 | 6,915 | 53,400 | 12.9% |
| 5 | Fredericton | New Brunswick | 63,116 | 4,425 | 34,905 | 12.7% |
| 6 | Saanich | British Columbia | 117,735 | 7,410 | 62,535 | 11.8% |
| 7 | Kingston | Ontario | 132,485 | 7,710 | 66,980 | 11.5% |
| 8 | St. John's | Newfoundland and Labrador | 110,525 | 6,020 | 57,380 | 10.5% |
| 9 | St. Albert | Alberta | 68,232 | 3,775 | 36,040 | 10.5% |
| 10 | Halifax | Nova Scotia | 439,819 | 24,935 | 242,690 | 10.3% |
| 11 | Regina | Saskatchewan | 226,404 | 11,795 | 121,685 | 9.7% |
| 12 | Greater Sudbury | Ontario | 166,004 | 7,545 | 84,000 | 9.0% |
| 13 | Lévis | Quebec | 149,683 | 7,435 | 82,795 | 9.0% |
| 14 | Cape Breton | Nova Scotia | 93,694 | 3,520 | 41,585 | 8.5% |
| 15 | North Bay | Ontario | 52,662 | 2,045 | 25,420 | 8.0% |
St. John's (6,020 of 57,380) ranks just ahead of St. Albert (3,775 of 36,040). Both round to 10.5%. Greater Sudbury (7,545 of 84,000) ranks just ahead of Lévis (7,435 of 82,795). Both round to 9.0%.
Québec in that table is the city, population 549,459, not the province. The city's share is 13.4% (39,380 of 293,660). The province's share is 6.6% (290,765 of 4,435,460). Saanich is the district municipality, population 117,735. Victoria is the city, 4th at 12.9% (6,915 of 53,400). Halifax is the regional municipality, population 439,819.
Ottawa, at 21.1% (116,235 of 549,985), sits well above Ontario, at 5.8% (428,030 of 7,399,205). Fredericton, at 12.7% (4,425 of 34,905), sits above New Brunswick, at 9.1% (35,260 of 389,470).
The three shares, side by side
A high share in one sector is not the same fact as a high share in another. The leaders on each list, plus Calgary, Toronto, and Canada, use the same labour-force total for every column. Manufacturing, and agriculture, forestry, fishing and hunting, are in the last two columns.
| Place | Mining, oil and gas | Health care | Public administration | Manufacturing | Agriculture |
|---|---|---|---|---|---|
| Wood Buffalo | 29.6% | 6.6% | 4.8% | 2.0% | 0.2% |
| Thunder Bay | 1.5% | 20.0% | 7.2% | 3.6% | 1.5% |
| Gatineau | 0.2% | 12.5% | 26.2% | 2.7% | 0.4% |
| Ottawa | 0.1% | 11.4% | 21.1% | 3.0% | 0.4% |
| Calgary | 4.4% | 12.5% | 3.3% | 4.5% | 0.4% |
| Toronto | 0.1% | 10.8% | 3.6% | 6.4% | 0.2% |
| Canada | 1.2% | 12.7% | 6.2% | 8.0% | 2.3% |
Wood Buffalo is 2.0% manufacturing (850 of 42,655) and 0.2% agriculture (90 of 42,655). Both are below Canada. Sherbrooke, 3rd on health care, is 12.4% manufacturing (11,045 of 89,165), above Canada's 8.0% (1,540,490 of 19,310,340).
Among the 101 places, Granby leads manufacturing, at 21.1% (7,095 of 33,700). Norfolk County leads agriculture, forestry, fishing and hunting, at 8.1% (2,570 of 31,620). Canada's agriculture share is 2.3% (434,800 of 19,310,340). Norfolk County was 3rd on the occupation ranking in the trades-towns post, at 24.3% (7,685 of 31,620). A job in the trades and a job in agriculture are different census facts, and both are different from the industry of the employer.
Where the largest cities land
Five census subdivisions in the file have 1,000,000 residents or more. On mining, oil and gas, Calgary is 6th, at 4.4% (32,410 of 730,050). Edmonton is 14th, at 1.8% (10,225 of 554,040). Toronto is 82nd, at 0.1% (1,985 of 1,518,420). Montréal is 86th, at 0.1% (1,195 of 959,130). Ottawa is 94th, at 0.1% (550 of 549,985).
Winnipeg, at 749,607 residents, is 69th on mining, at 0.2% (665 of 402,365). Vancouver, at 662,248 residents, is 38th, at 0.3% (1,250 of 394,670).
On health care, Edmonton is 38th, at 13.9% (77,255 of 554,040). Montréal is 45th, at 13.4% (128,175 of 959,130). Calgary is 58th, at 12.5% (90,910 of 730,050). Ottawa is 70th, at 11.4% (62,860 of 549,985). Toronto is 79th, at 10.8% (163,465 of 1,518,420), below Canada's 12.7%, with the largest count. Winnipeg is 26th, at 15.0% (60,445 of 402,365). Vancouver is 68th, at 11.6% (45,910 of 394,670).
Gatineau, at 291,041 residents, is already 1st on public administration. On health care it is 57th, at 12.5% (19,415 of 155,315), just ahead of Calgary. Both round to 12.5%.
On public administration, Ottawa is 2nd. Edmonton is 23rd, at 6.5% (36,125 of 554,040). Saint-Jean-sur-Richelieu is 24th, at 6.5% (3,335 of 51,225). Winnipeg is 25th, at 6.5% (26,050 of 402,365). All three round to 6.5%. Edmonton's unrounded share is the highest of the three. Toronto is 83rd, at 3.6% (54,970 of 1,518,420). Montréal is 72nd, at 4.0% (38,595 of 959,130). Calgary is 93rd, at 3.3% (24,185 of 730,050). Vancouver is 78th, at 3.9% (15,240 of 394,670).
The low end of the 50,000-person list
Brampton is last on mining, oil and gas, at 0.1%. The five lowest all round to 0.1%. They rank on the unrounded share.
| Rank | Place | Province | Population | Mining, quarrying, and oil and gas | Labour force | Share |
|---|---|---|---|---|---|---|
| 97 | Niagara Falls | Ontario | 94,415 | 45 | 46,120 | 0.1% |
| 98 | Kitchener | Ontario | 256,885 | 135 | 139,695 | 0.1% |
| 99 | Markham | Ontario | 338,503 | 135 | 170,540 | 0.1% |
| 100 | Vaughan | Ontario | 323,103 | 135 | 176,630 | 0.1% |
| 101 | Brampton | Ontario | 656,480 | 225 | 355,755 | 0.1% |
Waterloo, at 0.1% (65 of 65,955), is 96th, just ahead of Niagara Falls (45 of 46,120). Kitchener, Markham, and Vaughan each have a count of 135. Kitchener (135 of 139,695) ranks ahead of Markham (135 of 170,540), which ranks ahead of Vaughan (135 of 176,630).
Wood Buffalo is last on health care, at 6.6%. The five lowest:
| Rank | Place | Province | Population | Health care and social assistance | Labour force | Share |
|---|---|---|---|---|---|---|
| 97 | Brampton | Ontario | 656,480 | 30,440 | 355,755 | 8.6% |
| 98 | Aurora | Ontario | 62,057 | 2,835 | 34,205 | 8.3% |
| 99 | Halton Hills | Ontario | 62,951 | 2,785 | 36,155 | 7.7% |
| 100 | Caledon | Ontario | 76,581 | 3,235 | 43,140 | 7.5% |
| 101 | Wood Buffalo | Alberta | 72,326 | 2,815 | 42,655 | 6.6% |
Waterloo is 96th on health care, at 8.6% (5,670 of 65,955), just ahead of Brampton (30,440 of 355,755). Both round to 8.6%.
Brampton is also last on public administration, at 2.7%. The five lowest:
| Rank | Place | Province | Population | Public administration | Labour force | Share |
|---|---|---|---|---|---|---|
| 97 | Drummondville | Quebec | 79,258 | 1,185 | 39,755 | 3.0% |
| 98 | Kitchener | Ontario | 256,885 | 4,085 | 139,695 | 2.9% |
| 99 | Waterloo | Ontario | 121,436 | 1,900 | 65,955 | 2.9% |
| 100 | Windsor | Ontario | 229,660 | 2,925 | 106,880 | 2.7% |
| 101 | Brampton | Ontario | 656,480 | 9,670 | 355,755 | 2.7% |
Kitchener (4,085 of 139,695) ranks just ahead of Waterloo (1,900 of 65,955). Both round to 2.9%. Windsor (2,925 of 106,880) ranks just ahead of Brampton (9,670 of 355,755). Both round to 2.7%.
The national figure
For Canada, 239,030 people worked in mining, quarrying, and oil and gas extraction out of a labour force of 19,310,340, which is 1.2%. Health care and social assistance was 2,446,370, which is 12.7%. Public administration was 1,188,915, which is 6.2%. The country's 2021 population was 36,991,981. That Canada figure is the country's published counts in the location file. It is not the sum of the municipal rows above.
Among the 101 places of 50,000 or more, the median mining share was 0.2%. Victoria holds that middle place, 51st, at 0.2% (130 of 53,400). The median health-care share was 13.1%. St. Albert holds that middle place, 51st, at 13.1% (4,735 of 36,040). Fredericton is 50th and also rounds to 13.1% (4,590 of 34,905). The median public-administration share was 4.9%. Ajax holds that middle place, 51st, at 4.9% (3,350 of 68,525).
On the one-decimal shares used in the tables, 18 places round above Canada's 1.2% on mining and 83 round lower. None round to 1.2%. On health care, 53 places round above Canada's 12.7%, Mirabel (4,530 of 35,560) and Oshawa (11,115 of 87,550) round to the same 12.7%, and 46 round lower. On public administration, 28 places round above Canada's 6.2%, three round to the same 6.2% — Medicine Hat (1,965 of 31,715), Sault Ste. Marie (2,050 of 33,215), and Kawartha Lakes (2,245 of 36,500) — and 70 round lower.
Added together, those 101 places had 106,045 people in mining, oil and gas out of a labour force of 12,888,495, a combined share of 0.8%. Health care was 12.5% (1,608,060 of 12,888,495). Public administration was 5.9% (764,710 of 12,888,495). The 314 places of 10,000 to 49,999 combine to 1.6% on mining (52,905 of 3,257,685), 13.0% on health care (422,220 of 3,257,685), and 6.6% on public administration (214,360 of 3,257,685).
The median counts each municipality once. The combined share counts every person in the labour force. On mining, large counts in Calgary, Wood Buffalo, and Edmonton pull the 50,000-person group above the median, and the group still sits below Canada. The smaller band, taken together, sits above Canada. On health care, the 101 places together sit just below Canada, and the smaller band sits just above it. On public administration, the 101 places together sit below Canada, and the smaller band sits above it.
Alberta was the highest province or territory on mining, oil and gas, at 4.9% (112,890 of 2,295,380). The Northwest Territories were next, at 4.3% (980 of 22,550). Prince Edward Island was the lowest, at 0.2% (200 of 83,500). Calgary, at 4.4%, sits near the Alberta share.
Newfoundland and Labrador was the highest on health care, at 16.5% (40,245 of 243,330). Nunavut was the lowest, at 9.1% (1,310 of 14,380). Among provinces, Ontario was the lowest, at 11.6% (859,910 of 7,399,205).
Nunavut was the highest on public administration, at 29.3% (4,220 of 14,380). The Northwest Territories were next, at 27.4% (6,185 of 22,550). Yukon was 24.6% (5,785 of 23,520). Among provinces, Prince Edward Island was the highest, at 10.9% (9,105 of 83,500). Alberta was the lowest province or territory, at 5.2% (118,270 of 2,295,380).
Places of 10,000 to 49,999
Dropping the floor to 10,000 residents, and stopping below 50,000, leaves 314 census subdivisions. None of them exceed Wood Buffalo's 29.6% on mining, oil and gas. Bonnyville No. 87, at 12,897 residents, is first, at 19.7%. The top 10 are below. Seven are in Alberta, and one each in Ontario, Quebec, and Saskatchewan.
| Rank | Place | Province | Population | Mining, quarrying, and oil and gas | Labour force | Share |
|---|---|---|---|---|---|---|
| 1 | Bonnyville No. 87 | Alberta | 12,897 | 1,345 | 6,815 | 19.7% |
| 2 | Yellowhead County | Alberta | 10,426 | 785 | 5,220 | 15.0% |
| 3 | Timmins | Ontario | 41,145 | 3,145 | 21,010 | 15.0% |
| 4 | Val-d'Or | Quebec | 32,752 | 2,615 | 17,545 | 14.9% |
| 5 | Lloydminster (Part) | Alberta | 19,739 | 1,520 | 10,735 | 14.2% |
| 6 | Estevan | Saskatchewan | 10,851 | 835 | 5,980 | 14.0% |
| 7 | Clearwater County | Alberta | 11,865 | 845 | 6,475 | 13.1% |
| 8 | Cold Lake | Alberta | 15,661 | 1,120 | 8,740 | 12.8% |
| 9 | Grande Prairie County No. 1 | Alberta | 23,769 | 1,665 | 13,250 | 12.6% |
| 10 | Sylvan Lake | Alberta | 15,995 | 1,070 | 8,835 | 12.1% |
Yellowhead County (785 of 5,220) ranks just ahead of Timmins (3,145 of 21,010). Both round to 15.0%. Yellowhead County was 5th on the occupation ranking in the trades-towns post, at 29.4% (1,535 of 5,220).
Bonnyville No. 87 is the municipal district. Bonnyville, the town, is a separate census subdivision of 6,404 residents. It falls below the 10,000 floor, so it is not in this ranking. Lloydminster (Part) is the Alberta census subdivision in this file, population 19,739. A Saskatchewan part is not a separate row here. Grande Prairie County No. 1, population 23,769, is a different census subdivision from the city of Grande Prairie, population 64,141, which is 2nd on the 50,000-person list.
Fourteen places in this band post a higher health-care share than Thunder Bay's 20.0%. Grand Falls-Windsor, at 13,853 residents, is first, at 24.2% (1,520 of 6,270). The top 10 are below. Three are in Quebec, two in Newfoundland and Labrador, two in Ontario, and one each in Saskatchewan, New Brunswick, and Nova Scotia.
| Rank | Place | Province | Population | Health care and social assistance | Labour force | Share |
|---|---|---|---|---|---|---|
| 1 | Grand Falls-Windsor | Newfoundland and Labrador | 13,853 | 1,520 | 6,270 | 24.2% |
| 2 | Saint-Charles-Borromée | Quebec | 15,285 | 1,380 | 6,065 | 22.8% |
| 3 | Elliot Lake | Ontario | 11,372 | 785 | 3,540 | 22.2% |
| 4 | North Battleford | Saskatchewan | 13,836 | 1,510 | 6,850 | 22.0% |
| 5 | Edmundston | New Brunswick | 16,437 | 1,620 | 7,410 | 21.9% |
| 6 | Kenora | Ontario | 14,967 | 1,630 | 7,750 | 21.0% |
| 7 | Corner Brook | Newfoundland and Labrador | 19,333 | 1,860 | 8,920 | 20.9% |
| 8 | Rimouski | Quebec | 48,935 | 4,975 | 23,870 | 20.8% |
| 9 | Yarmouth | Nova Scotia | 10,067 | 1,055 | 5,085 | 20.7% |
| 10 | Baie-Comeau | Quebec | 20,687 | 2,105 | 10,300 | 20.4% |
Four more also exceed Thunder Bay. Selkirk is 11th, at 20.3% (930 of 4,590). Portage la Prairie is 12th, at 20.2% (1,305 of 6,445). Owen Sound is 13th, at 20.2% (1,980 of 9,790). Gander is 14th, at 20.1% (1,195 of 5,940). Portage la Prairie ranks just ahead of Owen Sound. Both round to 20.2%.
Yarmouth in this table is the municipal district, population 10,067. Yarmouth, the town, is a separate census subdivision of 6,829 residents. It falls below the 10,000 floor, so it is not in this ranking.
Three places in this band exceed Gatineau's 26.2% on public administration. Petawawa, at 18,160 residents, is first, at 45.4% (4,305 of 9,475). Yellowknife is second, at 29.5%. Cantley is third, at 28.8%. The top 10 are below.
| Rank | Place | Province | Population | Public administration | Labour force | Share |
|---|---|---|---|---|---|---|
| 1 | Petawawa | Ontario | 18,160 | 4,305 | 9,475 | 45.4% |
| 2 | Yellowknife | Northwest Territories | 20,340 | 3,675 | 12,475 | 29.5% |
| 3 | Cantley | Quebec | 11,449 | 1,910 | 6,625 | 28.8% |
| 4 | Cold Lake | Alberta | 15,661 | 2,185 | 8,740 | 25.0% |
| 5 | Whitehorse | Yukon | 28,201 | 4,110 | 16,900 | 24.3% |
| 6 | Val-des-Monts | Quebec | 13,328 | 1,705 | 7,470 | 22.8% |
| 7 | Russell | Ontario | 19,598 | 2,345 | 11,065 | 21.2% |
| 8 | Clarence-Rockland | Ontario | 26,505 | 2,850 | 13,875 | 20.5% |
| 9 | Esquimalt | British Columbia | 17,533 | 2,045 | 9,980 | 20.5% |
| 10 | Colwood | British Columbia | 18,961 | 2,030 | 10,200 | 19.9% |
Clarence-Rockland (2,850 of 13,875) ranks just ahead of Esquimalt (2,045 of 9,980). Both round to 20.5%. Esquimalt is the district municipality, population 17,533. Cold Lake is 8th on the smaller mining list, at 12.8% (1,120 of 8,740), and 4th here, at 25.0% (2,185 of 8,740). The two shares use the same labour-force total.
Iqaluit, at 7,429 residents, falls below the 10,000 floor. Its public-administration share is 43.5% (1,835 of 4,220). It is not in this ranking. The 45.4% in Petawawa is the whole public-administration sector. The file does not split defence employment out of that sector.
Random rounding moves a share more when the labour force is small. Petawawa's denominator is 9,475 people. Gatineau's is 155,315, and Toronto's is 1,518,420. A few people rounded into or out of a count change the first decimal in the smaller place and do not change it in the larger one. The ranks above use the published counts as stored.
Questions the rankings can answer
Which places have the highest oil and gas share? Among places of 50,000 or more, Wood Buffalo, at 29.6% (12,625 of 42,655), then Grande Prairie, at 10.2% (3,750 of 36,645). The census sector is mining, quarrying, and oil and gas extraction. Greater Sudbury is 3rd, at 9.1% (7,620 of 84,000), and the file does not split mining from oil and gas. Among places of 10,000 to 49,999, Bonnyville No. 87 is first, at 19.7% (1,345 of 6,815), still below Wood Buffalo.
Does the highest share mean the most jobs? The share and the count answer different questions. Calgary's mining count is 32,410, larger than Wood Buffalo's 12,625, at a share of 4.4% (32,410 of 730,050). Toronto's health-care count is 163,465, larger than Thunder Bay's 10,685, at a share of 10.8% (163,465 of 1,518,420). Ottawa's public-administration count is 116,235, larger than Gatineau's 40,725, at a share of 21.1% (116,235 of 549,985).
Where is health care the largest share of the local labour force? Thunder Bay, at 20.0% (10,685 of 53,350), among places of 50,000 or more. Canada is 12.7% (2,446,370 of 19,310,340). Grand Falls-Windsor leads the 10,000-to-49,999 list, at 24.2% (1,520 of 6,270). The sector includes social assistance. The file does not split that out.
Where is public administration the largest share? Among places of 50,000 or more, Gatineau, at 26.2% (40,725 of 155,315), then Ottawa, at 21.1%. Among places of 10,000 to 49,999, Petawawa, at 45.4% (4,305 of 9,475). Iqaluit, below that floor, is 43.5% (1,835 of 4,220). The column is the whole sector.
What are the cutoff and the denominator? The headline list is 101 census subdivisions with 50,000 or more residents. The smaller list is 314 census subdivisions with 10,000 to 49,999 residents. The denominator is the published labour force aged 15 and over, the same total as the industry section on each location page. Oakville led the worked-at-home ranking and the bachelor's-degree ranking. On this map its mining share is 0.4% (465 of 113,190), its health-care share is 9.4% (10,655 of 113,190), and its public-administration share is 3.6% (4,035 of 113,190).
Compare a place yourself
Open any linked place for the full industry breakdown, or set two places side by side in the comparison tool. The education, commute, occupation, and industry sections use the same anchors on location pages and in that tool. The worked-at-home ranking is in Canada's top work-from-home cities. The occupation ranking is in Canada's trades-heavy towns. The credential ranking is in bachelor's vs trades.
Sources
Industry counts, including mining, quarrying, and oil and gas extraction, health care and social assistance, public administration, manufacturing, and agriculture, forestry, fishing and hunting, plus labour-force totals and population, are from the Statistics Canada 2021 Census of Population (Census Profile), as stored for each place in the Canadian Data Insights location file. Shares on this page are calculated here from those published counts. The occupation counts cited for comparison are from the same file. See how this site handles census data. Statistics Canada data is used under the Open Government Licence – Canada. This post is by Andrew.
Mining, quarrying, and oil and gas extraction, places of 50,000 or more (percent)
Source: Statistics Canada, 2021 Census of Population
Data source → Census methodology & attribution
Back to All Insights