
Canada's Top Work-from-Home Cities (2021 Census)
Oakville led Canadian places of 50,000 or more: 44.9% worked at home in the 2021 Census. The national share was 24.3%. See the top 15 and the lowest.
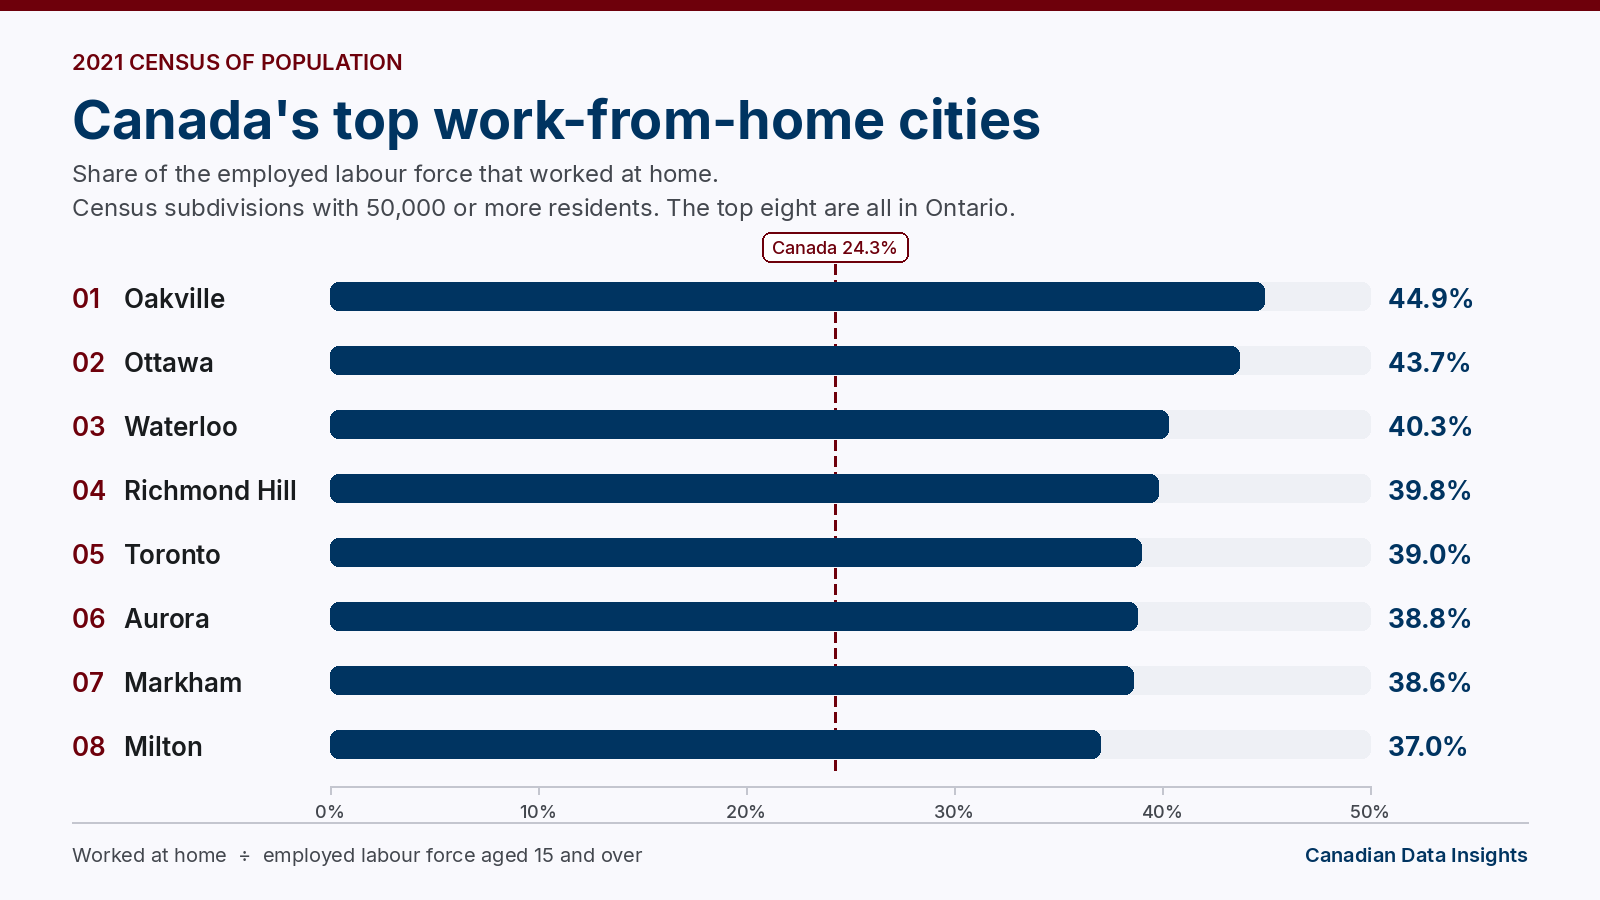
In the 2021 Census, 44.9% of Oakville's employed labour force worked at home — the highest share among Canada's 101 census subdivisions with 50,000 or more residents. Ottawa was next, at 43.7%. Across Canada, the same share was 24.3%.
The percentage is the published count of people who worked at home, divided by the published place-of-work total. On this site that total is the employed labour force aged 15 and over. It is the same calculation as the commute section on each location page: worked at home, usual place of work, no fixed workplace address, and worked outside Canada.
The census question refers to the reference week in May 2021, when COVID-19 restrictions were still widespread. These shares are higher than they would be in a more ordinary week after offices reopened. "Worked at home" also includes people whose job is based at home, not only employees who left an office temporarily. The file does not split those groups apart.
Places of 50,000 or more
The ranking below keeps the list to census subdivisions — cities, towns, and other municipalities — with a 2021 population of at least 50,000. That threshold leaves 101 places. Smaller municipalities can post very high shares, and a separate list further down covers places of 10,000 to 49,999. Every figure is calculated from the census counts in this site's location file. Statistics Canada randomly rounds those counts, so a set of categories can miss its published total by a few people. This page does not adjust for that.
Thirteen of the top 15 are in Ontario. Toronto does not lead the share, but it has the largest worked-at-home count in the group: 510,240 people.
| Rank | Place | Province | Population | Worked at home | Employed labour force | Share |
|---|---|---|---|---|---|---|
| 1 | Oakville | Ontario | 213,759 | 44,885 | 99,945 | 44.9% |
| 2 | Ottawa | Ontario | 1,017,449 | 215,705 | 493,140 | 43.7% |
| 3 | Waterloo | Ontario | 121,436 | 23,380 | 58,050 | 40.3% |
| 4 | Richmond Hill | Ontario | 202,022 | 37,055 | 93,020 | 39.8% |
| 5 | Toronto | Ontario | 2,794,356 | 510,240 | 1,308,110 | 39.0% |
| 6 | Aurora | Ontario | 62,057 | 11,720 | 30,170 | 38.8% |
| 7 | Markham | Ontario | 338,503 | 56,810 | 147,070 | 38.6% |
| 8 | Milton | Ontario | 132,979 | 23,160 | 62,640 | 37.0% |
| 9 | Burlington | Ontario | 186,948 | 33,075 | 89,495 | 37.0% |
| 10 | Pickering | Ontario | 99,186 | 16,745 | 46,790 | 35.8% |
| 11 | North Vancouver District | British Columbia | 88,168 | 15,400 | 44,490 | 34.6% |
| 12 | Whitby | Ontario | 138,501 | 22,440 | 64,840 | 34.6% |
| 13 | Vaughan | Ontario | 323,103 | 53,225 | 154,615 | 34.4% |
| 14 | Vancouver | British Columbia | 662,248 | 123,110 | 359,280 | 34.3% |
| 15 | Mississauga | Ontario | 717,961 | 111,685 | 331,995 | 33.6% |
Waterloo in this table is the city of 121,436, not a regional total. Shares are shown to one decimal place, matching the location pages. Two pairs round to the same tenth. Milton (23,160 of 62,640) ranks just ahead of Burlington (33,075 of 89,495), and North Vancouver District (15,400 of 44,490) just ahead of Whitby (22,440 of 64,840), on the unrounded share. North Vancouver District is the district municipality, not the City of North Vancouver, which had 58,120 residents and a worked-at-home share of 30.6% (9,930 of 32,490).
Where the largest cities land
Outside this top 15, the next-largest cities sit much closer to the national figure, or below it. Montréal ranked 21st at 30.3% (260,415 of 859,920). Calgary ranked 25th at 28.5% (182,015 of 638,645). Edmonton ranked 50th at 21.1% (102,215 of 483,855). Winnipeg ranked 63rd at 18.8% (68,960 of 366,595).
The low end of the same list
The same 50,000-person cutoff produces a very different bottom. Brandon, Man., is last among the 101 places, at 8.5%. The five lowest:
| Rank | Place | Province | Population | Worked at home | Employed labour force | Share |
|---|---|---|---|---|---|---|
| 97 | Wood Buffalo | Alberta | 72,326 | 4,595 | 38,920 | 11.8% |
| 98 | Drummondville | Quebec | 79,258 | 4,285 | 37,540 | 11.4% |
| 99 | Medicine Hat | Alberta | 63,271 | 2,785 | 27,925 | 10.0% |
| 100 | Grande Prairie | Alberta | 64,141 | 3,095 | 32,300 | 9.6% |
| 101 | Brandon | Manitoba | 51,313 | 2,165 | 25,340 | 8.5% |
What the share is measuring
The census does not record a reason. Industry and education counts for the same places show why a high share, and a low one, can come from different kinds of work.
Oakville is a professional and highly educated suburb. 47.9% of residents aged 15 and over held a bachelor's degree or higher (83,230 of 173,625), compared with 26.7% in Canada (8,086,245 of 30,335,915). Professional, scientific and technical services were 15.0% of Oakville's labour force (17,005 of 113,190), compared with 8.1% nationally (1,571,160 of 19,310,340).
Ottawa combines that pattern with government employment. Public administration was 21.1% of the city's labour force (116,235 of 549,985), compared with 6.2% in Canada (1,188,915 of 19,310,340).
At the other end, Wood Buffalo's labour force was concentrated in mining, quarrying, and oil and gas extraction: 29.6% (12,625 of 42,655), compared with 1.2% nationally (239,030 of 19,310,340). Those jobs are much more likely to have a worksite, or no fixed workplace, than a home office. Industry shares use the published labour-force total, a wider base than the place-of-work total behind the worked-at-home percentage. Education shares use the population aged 15 and over. Location pages use those same denominators.
The national figure, and the group of 101
For Canada, 4,214,860 people worked at home out of an employed labour force of 17,321,700, which is 24.3%. The country's 2021 population was 36,991,981.
Among the 101 places of 50,000 or more, the median share was 21.0%. On the one-decimal shares used in the tables, 37 places round above Canada's 24.3%, Longueuil rounds to the same 24.3% (30,435 of 125,030), and 63 round lower. Added together, those 101 places had 3,154,420 people working at home out of 11,465,845 in the employed labour force, a combined share of 27.5%. The median counts each municipality once. The combined share counts every employed person, so large places with high shares — Toronto, Montréal, Vancouver, and Ottawa — pull it above both the median and the Canada figure.
Ontario was the highest province or territory in the file, at 29.7% (1,929,760 of 6,492,895). That lines up with an Ontario-heavy top of the municipal list.
Places of 10,000 to 49,999
Dropping the floor to 10,000 residents, and stopping below 50,000, leaves 314 census subdivisions. The top of that list is not a second copy of the big-city ranking. Several are small, affluent suburbs. One is a farming township. Westmount, at 19,658 residents, would have ranked above Oakville if the population floor were lower.
| Rank | Place | Province | Population | Worked at home | Employed labour force | Share |
|---|---|---|---|---|---|---|
| 1 | Westmount | Quebec | 19,658 | 3,965 | 8,680 | 45.7% |
| 2 | Beaconsfield | Quebec | 19,277 | 3,930 | 9,205 | 42.7% |
| 3 | Saint-Lambert | Quebec | 22,761 | 4,500 | 10,580 | 42.5% |
| 4 | West Vancouver District | British Columbia | 44,122 | 7,140 | 17,640 | 40.5% |
| 5 | Mont-Royal | Quebec | 20,953 | 3,690 | 9,410 | 39.2% |
| 6 | Wellesley | Ontario | 11,318 | 2,240 | 5,840 | 38.4% |
| 7 | Whitchurch-Stouffville | Ontario | 49,864 | 8,980 | 23,530 | 38.2% |
| 8 | Oak Bay District | British Columbia | 17,990 | 2,855 | 7,595 | 37.6% |
Westmount looks like the Oakville pattern, in a smaller place: 63.3% of residents aged 15 and over held a bachelor's degree or higher (10,415 of 16,450), and professional, scientific and technical services were 19.5% of the labour force (1,835 of 9,405). Wellesley, a township of 11,318 in Ontario, is a different case. Agriculture, forestry, fishing and hunting was 16.7% of its labour force (1,015 of 6,080), compared with 2.3% in Canada (434,800 of 19,310,340). A high worked-at-home share there is consistent with jobs based on the farm, not only with remote office work.
Compare a place yourself
Open any linked place for the full commute breakdown, or set two places side by side in the comparison tool. The commute, education, occupation, and industry sections use the same anchors on location pages and in that tool.
Sources
Worked-at-home counts, employed-labour-force totals, population, industry, and education counts are from the Statistics Canada 2021 Census of Population (Census Profile), as stored for each place in the Canadian Data Insights location file. Shares on this page are calculated here from those published counts. See how this site handles census data. Statistics Canada data is used under the Open Government Licence – Canada. This post is by Andrew.
Worked at home, places of 50,000 or more (percent)
Source: Statistics Canada, 2021 Census of Population
Data source → Census methodology & attribution
Back to All Insights