
Demographic Insights
Exploring the trends, challenges, and stories behind the 2021 Canadian Census. Long-form analysis to complement our data visualizations.

Toronto vs Montréal Population: 2,794,356 vs 1,762,949 + Income
Toronto is bigger, but Montréal grew faster (3.4% vs 2.3%). Median income is $74,000 in Toronto and $56,000 in Montréal. Age: Toronto 41.5, Montréal 40.6.
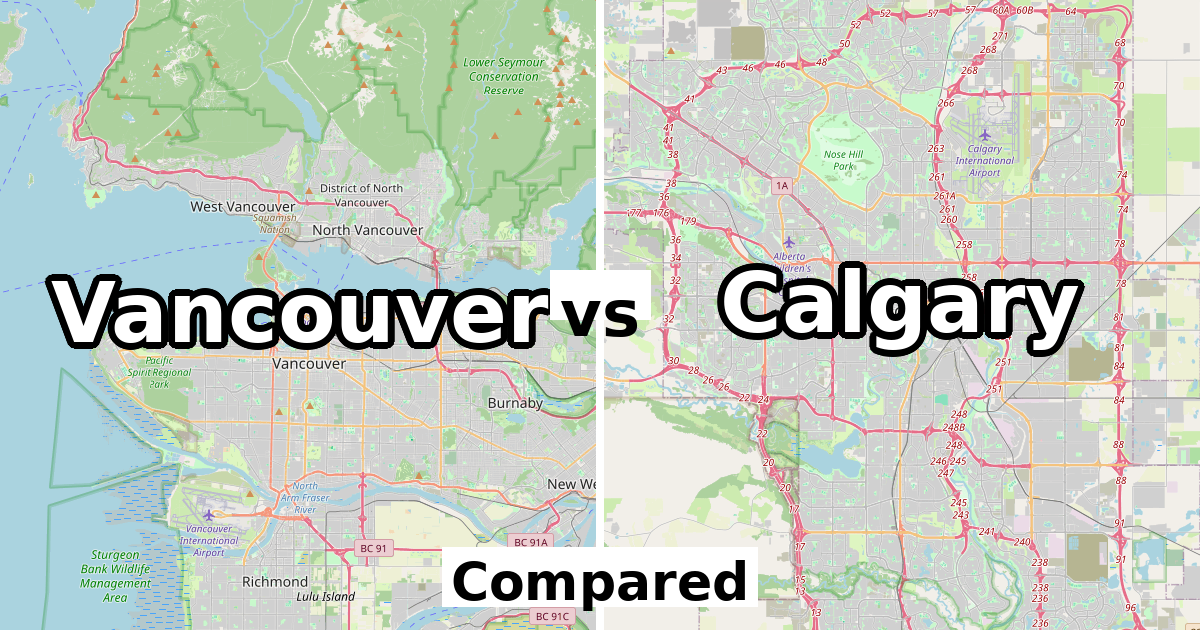
Vancouver vs Calgary Population: 662,248 vs 1,306,784 + Income
Calgary is larger (1,306,784 vs 662,248). Median after-tax household income is $85,000 in Calgary and $72,000 in Vancouver. Age: Vancouver 42.2, Calgary 38.8.
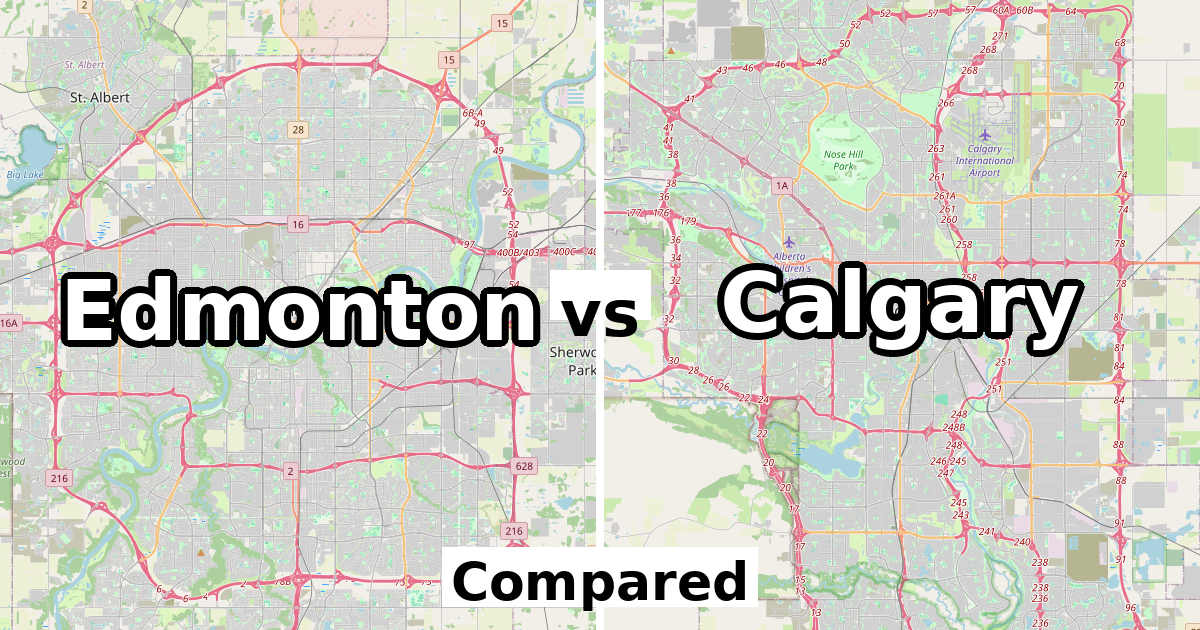
Edmonton vs Calgary Population: 1,010,899 vs 1,306,784 + Income
Calgary is bigger, but Edmonton grew faster (8.3% vs 5.5%). Median income is $85,000 in Calgary and $79,500 in Edmonton. Age: Edmonton 38.4, Calgary 38.8.

Ottawa vs Gatineau Population: 1,017,449 vs 291,041 + Income
Ottawa is larger and grew faster (8.9% vs 5.4%). Median after-tax income is $88,000 in Ottawa versus $69,500 in Gatineau. Age: Ottawa 40.7, Gatineau 40.3.

Mississauga vs Brampton Population: 717,961 vs 656,480 + Income
Mississauga is bigger, but it shrank while Brampton grew (10.6% vs -0.5%). Income: Mississauga $89,000, Brampton $98,000. Age: Mississauga 41.1, Brampton 37.5.
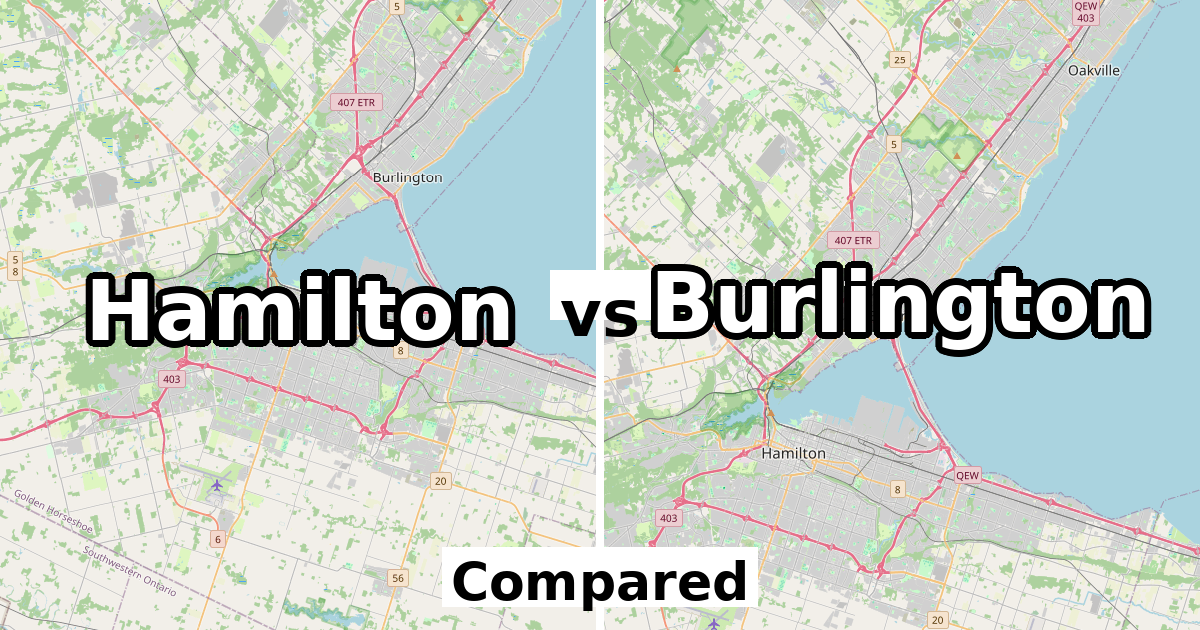
Hamilton vs Burlington Population: 569,353 vs 186,948 + Income
Hamilton is larger and grew faster (6.0% vs 2.0%). Median income is $94,000 in Burlington and $75,500 in Hamilton. Average age: Hamilton 41.5, Burlington 43.3.
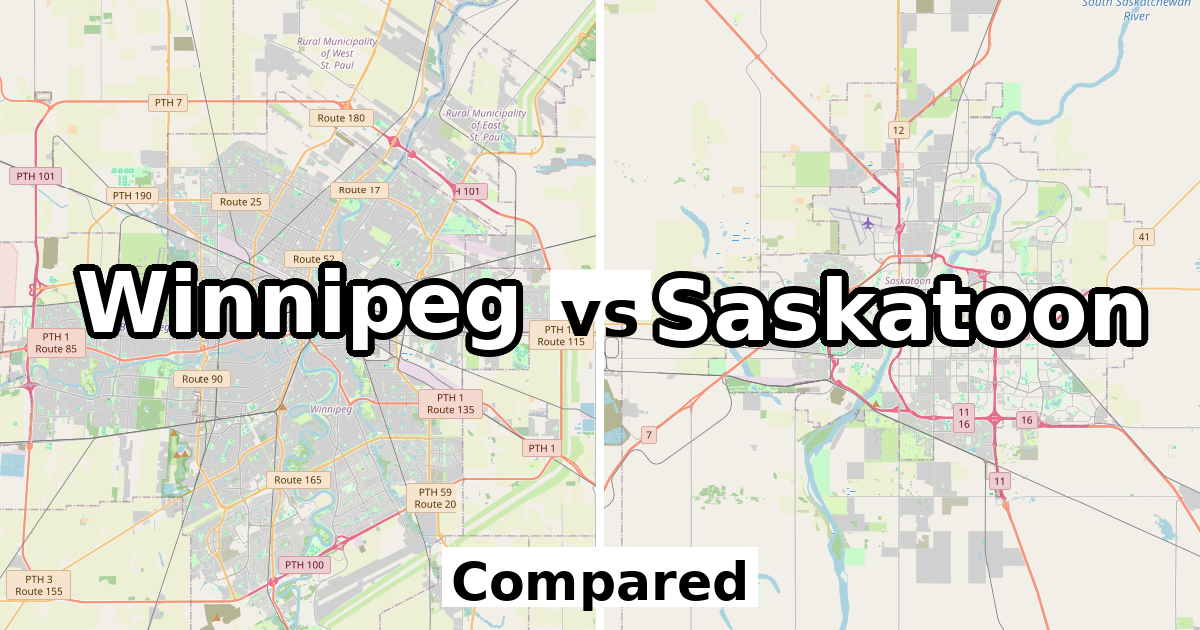
Winnipeg vs Saskatoon Population: 749,607 vs 266,141 + Income
Winnipeg is bigger, but Saskatoon grew faster (7.7% vs 6.3%). Median income is $74,500 in Saskatoon and $69,500 in Winnipeg. Age: Winnipeg 40.3, Saskatoon 38.8.

Halifax vs Québec Population: 439,819 vs 549,459 + Income
Québec is bigger, but Halifax grew faster (9.1% vs 3.3%). Median income is $69,500 in Halifax and $60,800 in Québec. Average age: Halifax 41.3, Québec 43.8.
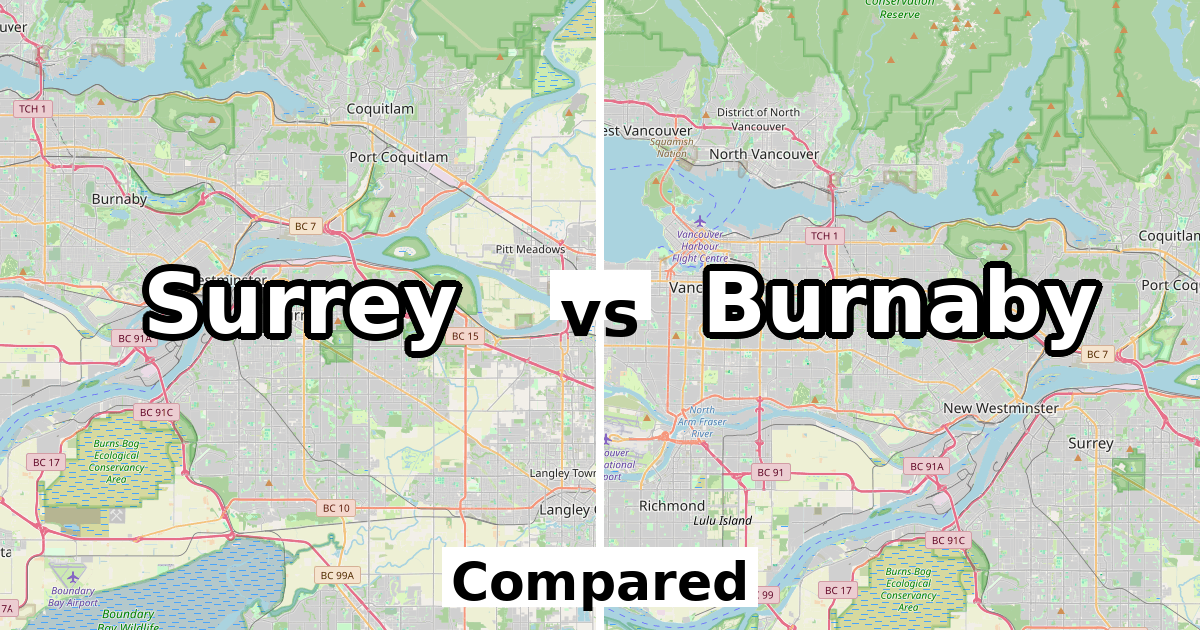
Surrey vs Burnaby Population: 568,322 vs 249,125 + Income
Surrey is larger and grew faster (9.7% vs 7.0%). Median after-tax household income is $87,000 in Surrey and $73,500 in Burnaby. Age: Surrey 39.5, Burnaby 42.
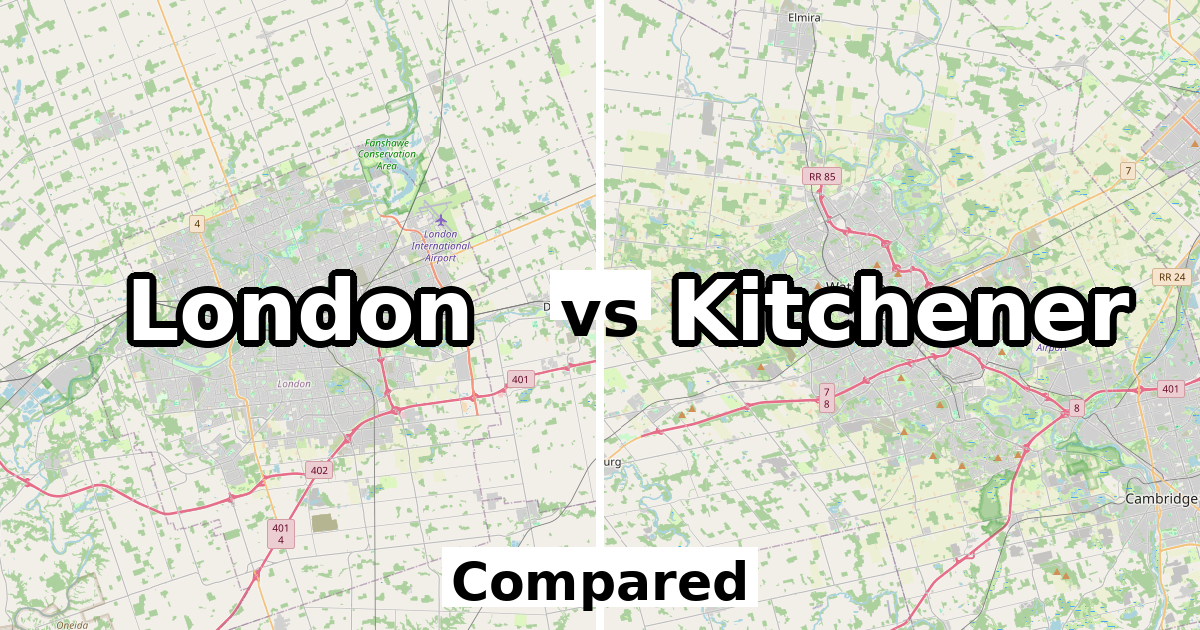
London vs Kitchener Population: 422,324 vs 256,885 + Income
London is larger (422,324 vs 256,885). Median after-tax household income is $76,500 in Kitchener and $68,500 in London. Average age: London 40.7, Kitchener 39.
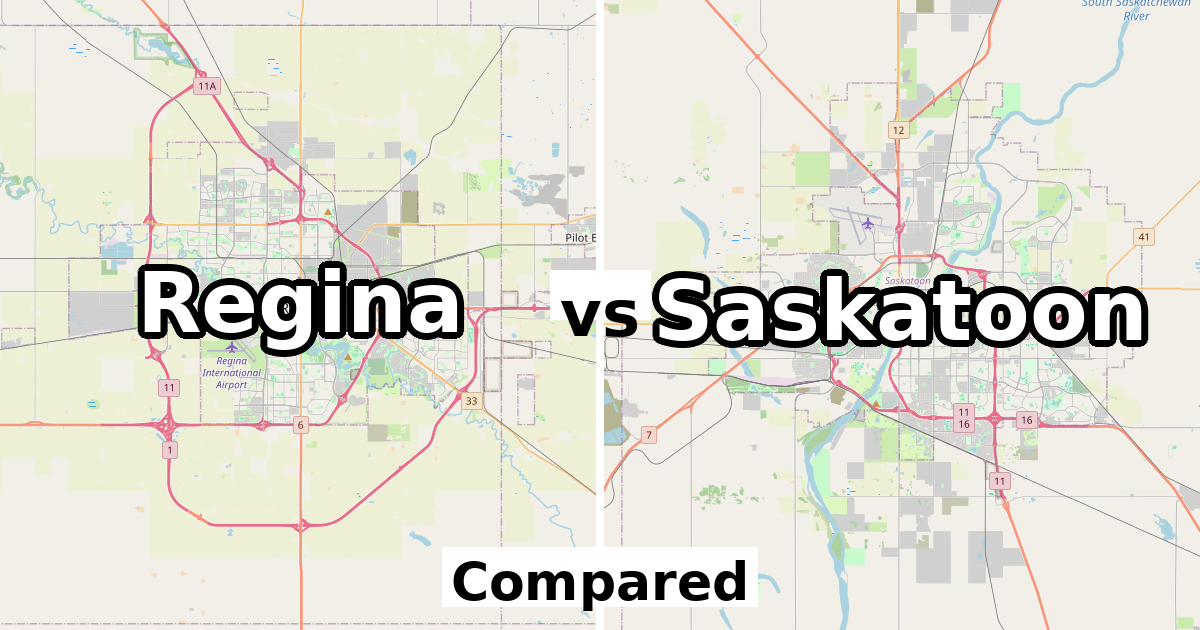
Regina vs Saskatoon Population: 226,404 vs 266,141 + Income
Saskatoon is larger and grew faster (7.7% vs 5.3%). Median after-tax income is $76,500 in Regina versus $74,500 in Saskatoon. Age: Regina 39, Saskatoon 38.8.
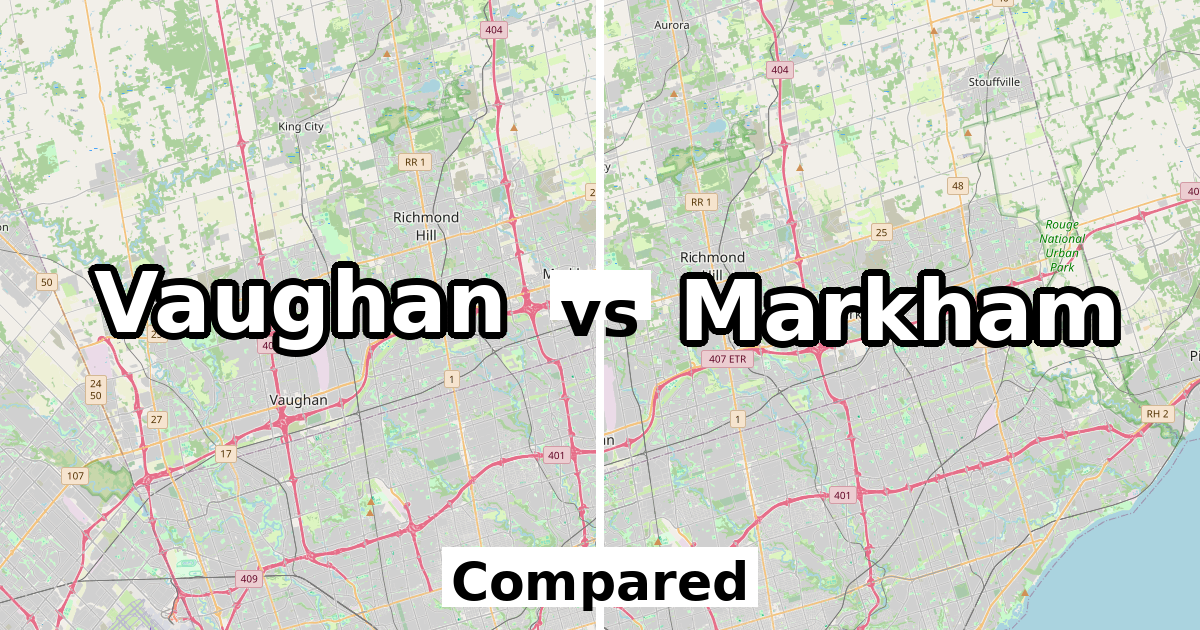
Vaughan vs Markham Population: 323,103 vs 338,503 + Income
Markham is bigger, but Vaughan grew faster (5.5% vs 2.9%). Median income is $107,000 in Vaughan and $92,000 in Markham. Average age: Vaughan 40.9, Markham 41.8.
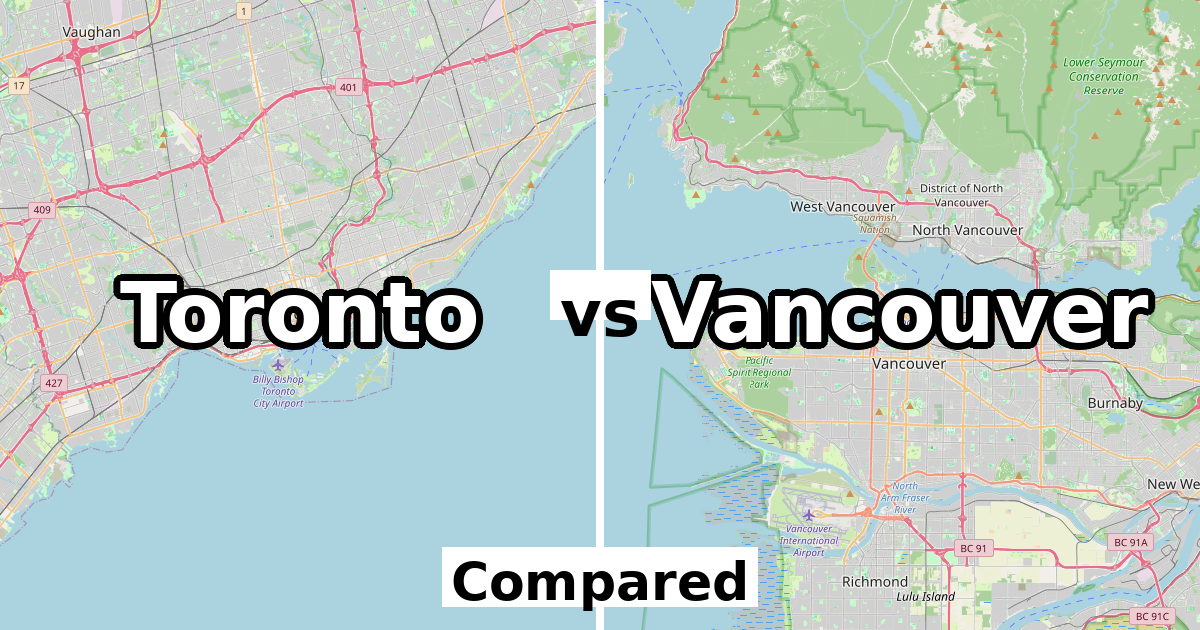
Toronto vs Vancouver Population: 2,794,356 vs 662,248 + Income
Toronto is bigger, but Vancouver grew faster (4.9% vs 2.3%). Median income is $74,000 in Toronto and $72,000 in Vancouver. Age: Toronto 41.5, Vancouver 42.2.
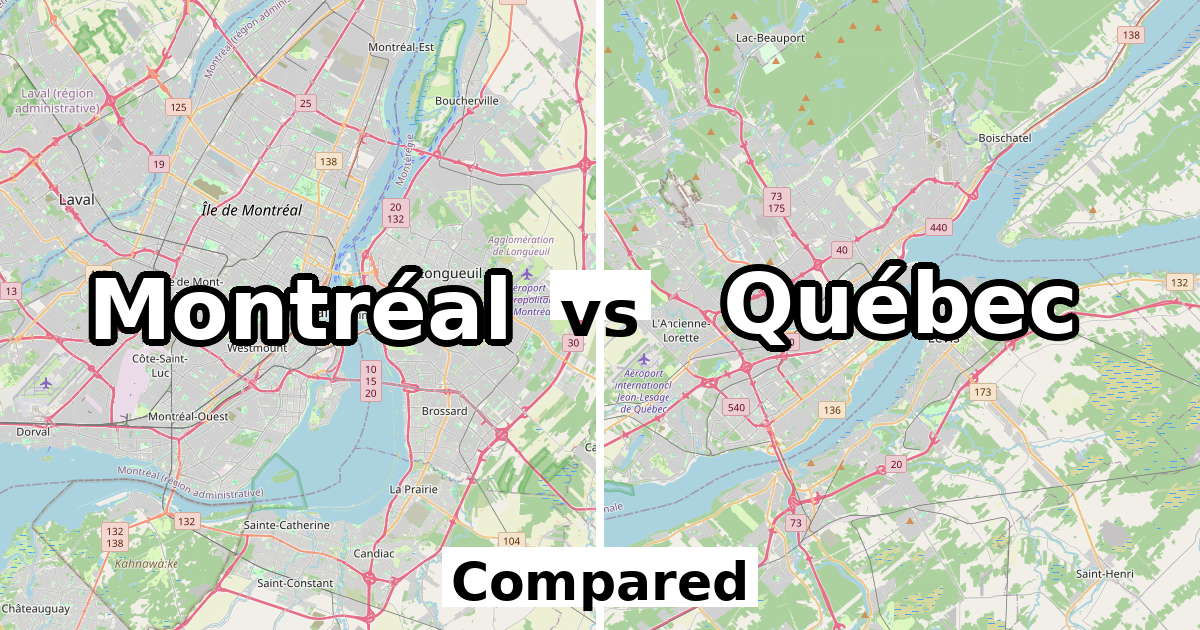
Montréal vs Québec Population: 1,762,949 vs 549,459 + Income
Montréal is larger (1,762,949 vs 549,459). Median after-tax household income is $60,800 in Québec and $56,000 in Montréal. Age: Montréal 40.6, Québec 43.8.

Ottawa vs Hamilton Population: 1,017,449 vs 569,353 + Income
Ottawa is larger and grew faster (8.9% vs 6.0%). Median after-tax income is $88,000 in Ottawa versus $75,500 in Hamilton. Age: Ottawa 40.7, Hamilton 41.5.
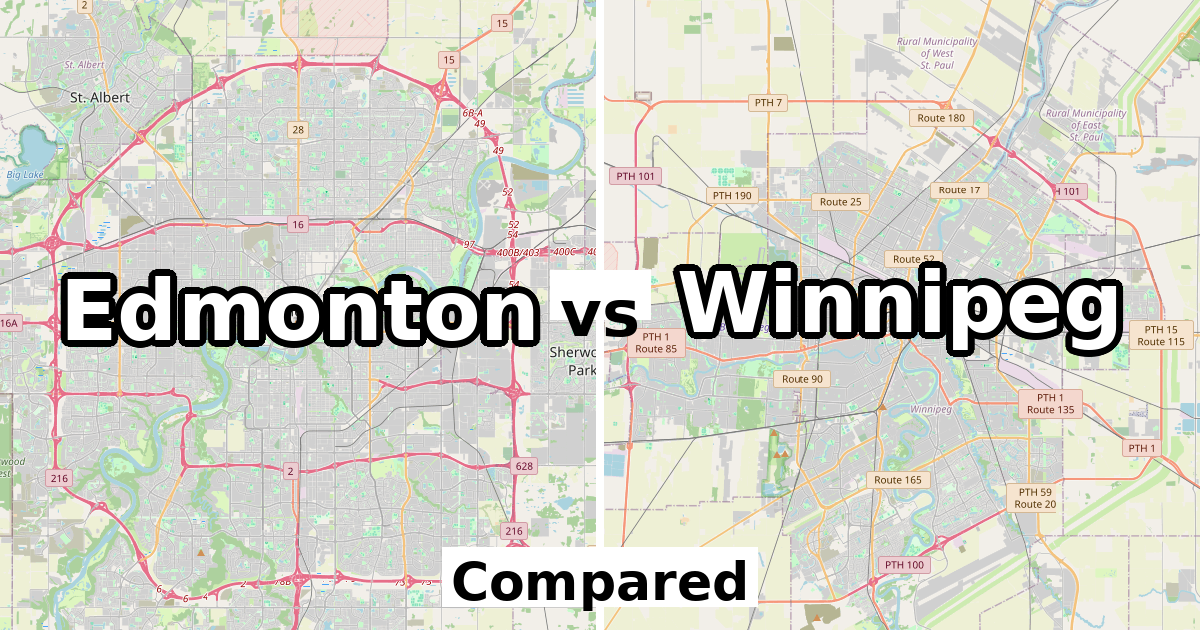
Edmonton vs Winnipeg Population: 1,010,899 vs 749,607 + Income
Edmonton is larger and grew faster (8.3% vs 6.3%). Median after-tax income is $79,500 in Edmonton versus $69,500 in Winnipeg. Age: Edmonton 38.4, Winnipeg 40.3.

Brampton vs Surrey Population: 656,480 vs 568,322 + Income
Brampton is larger (656,480 vs 568,322). Median after-tax household income is $98,000 in Brampton and $87,000 in Surrey. Age: Brampton 37.5, Surrey 39.5.
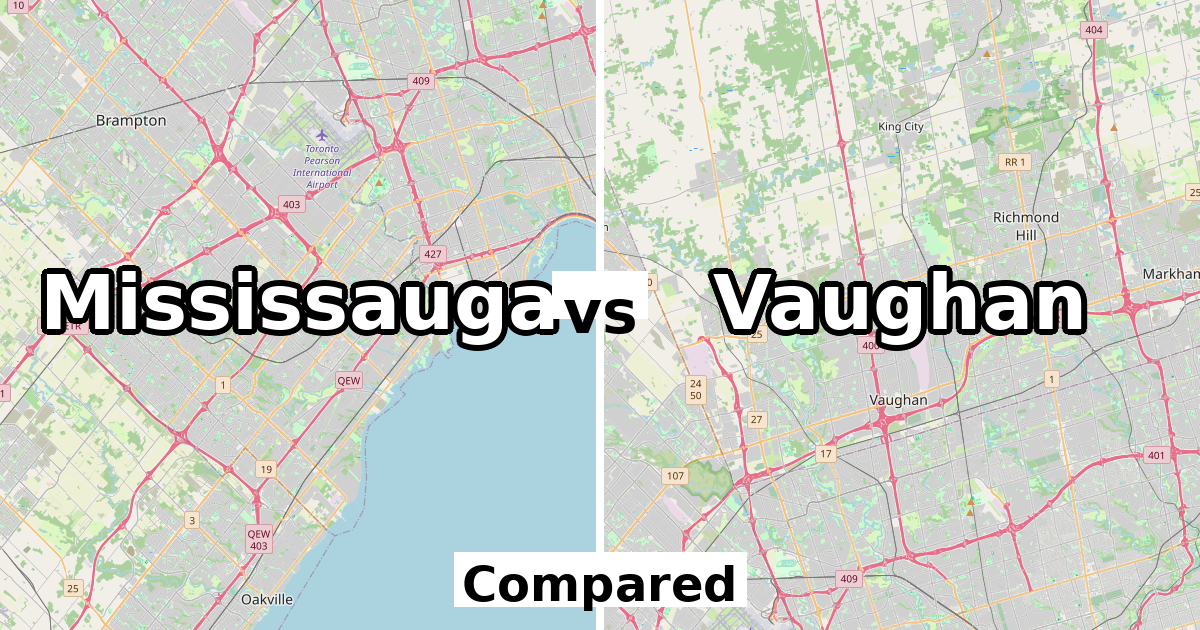
Mississauga vs Vaughan Population: 717,961 vs 323,103 + Income
Mississauga is bigger, but it shrank while Vaughan grew (5.5% vs -0.5%). Income: Mississauga $89,000, Vaughan $107,000. Age: Mississauga 41.1, Vaughan 40.9.
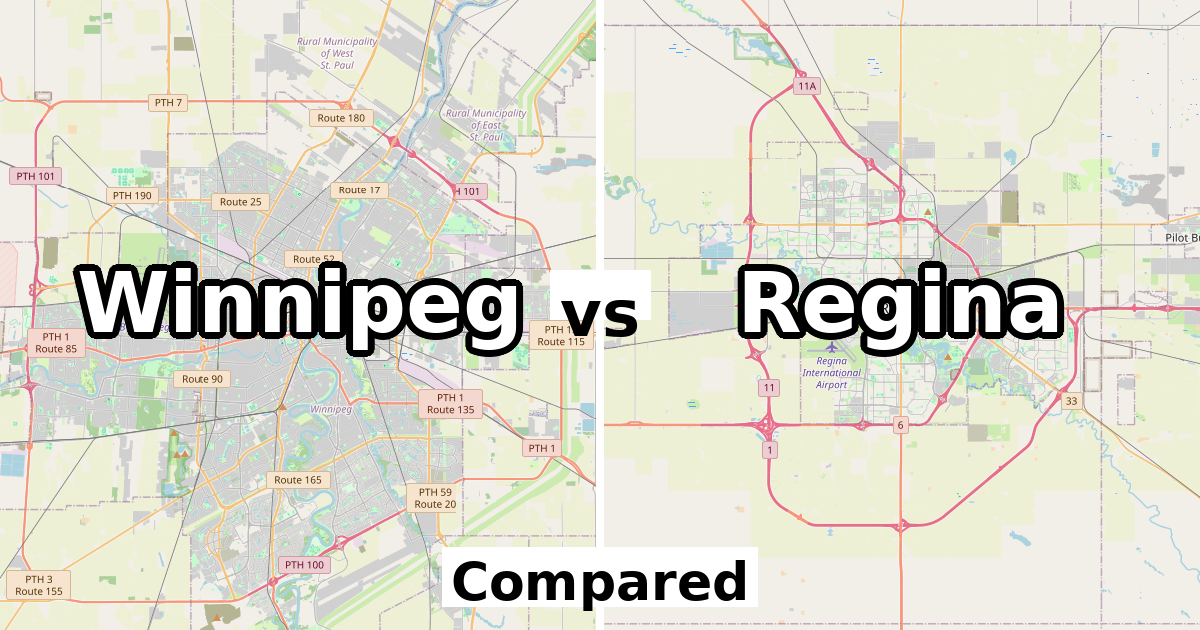
Winnipeg vs Regina Population: 749,607 vs 226,404 + Income
Winnipeg is larger and grew faster (6.3% vs 5.3%). Median after-tax income is $76,500 in Regina versus $69,500 in Winnipeg. Age: Winnipeg 40.3, Regina 39.
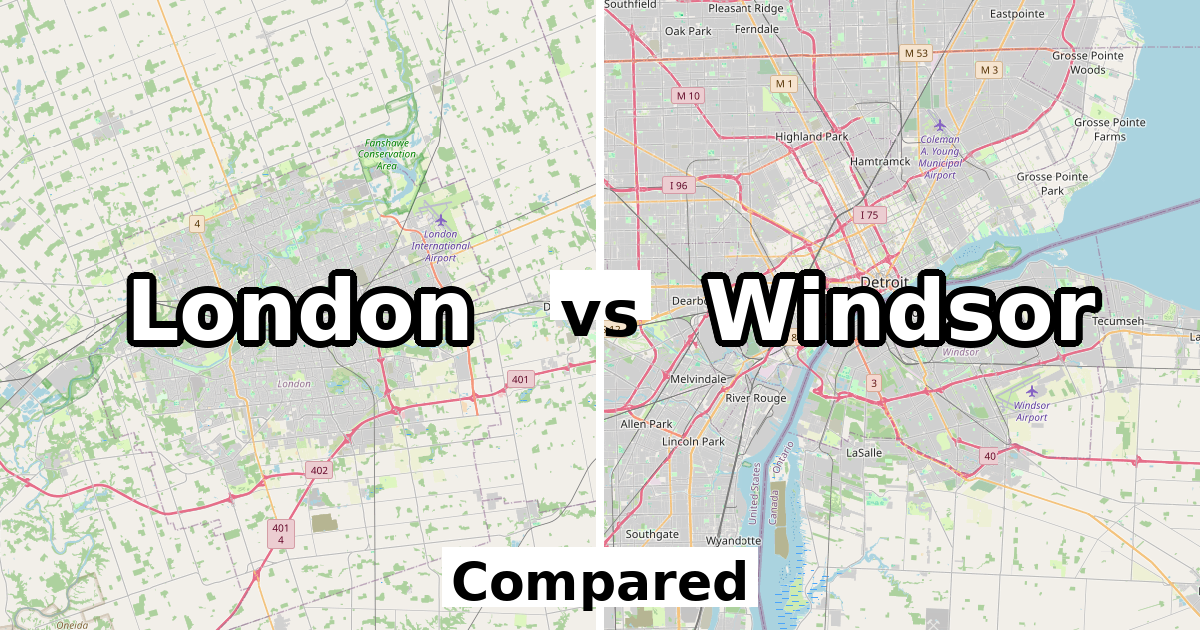
London vs Windsor Population: 422,324 vs 229,660 + Income
London is larger and grew faster (10.0% vs 5.7%). Median after-tax household income is $68,500 in London and $63,600 in Windsor. Age: London 40.7, Windsor 41.4.

Kelowna vs Nanaimo Population: 144,576 vs 99,863 + Income
Kelowna is larger and grew faster (13.5% vs 10.3%). Median after-tax income is $73,500 in Kelowna versus $68,500 in Nanaimo. Age: Kelowna 43.4, Nanaimo 44.8.
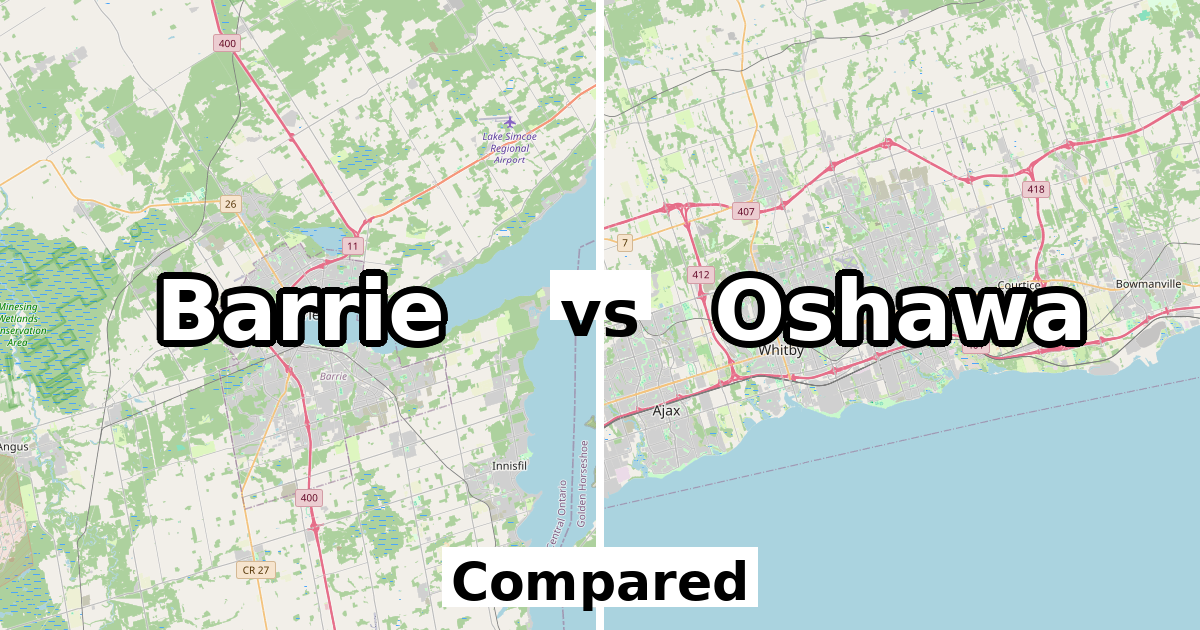
Barrie vs Oshawa Population: 147,829 vs 175,383 + Income
Oshawa is larger and grew faster (10.0% vs 4.5%). Median after-tax household income is $82,000 in Barrie and $76,000 in Oshawa. Age: Barrie 40.2, Oshawa 40.3.
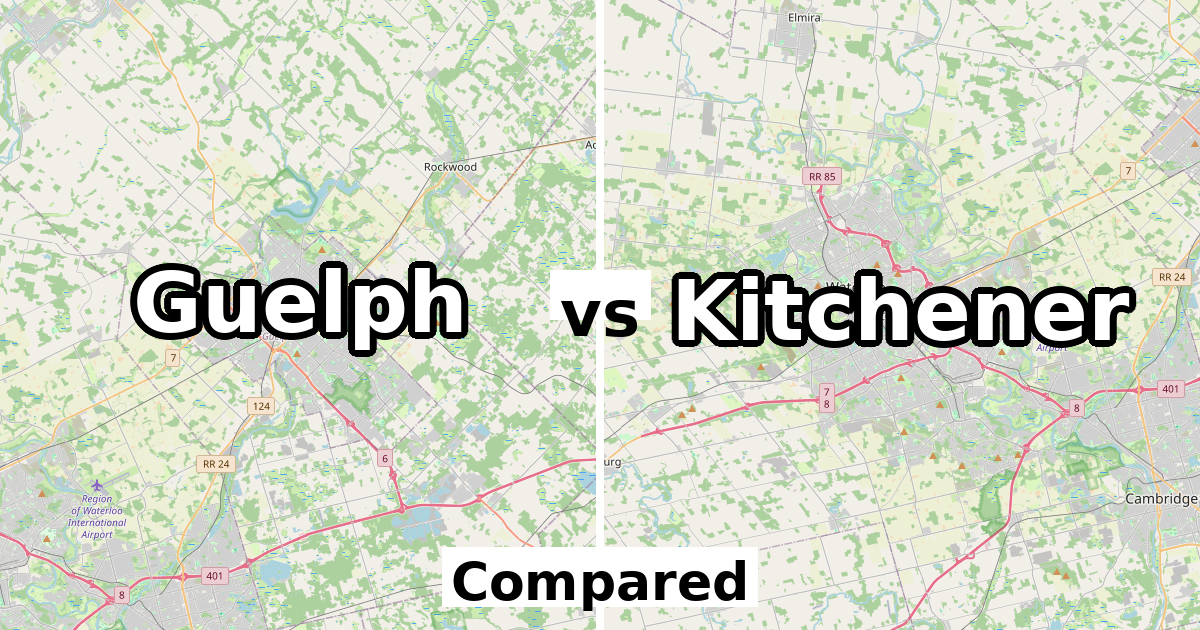
Guelph vs Kitchener Population: 143,740 vs 256,885 + Income
Kitchener is larger and grew faster (10.1% vs 9.1%). Median after-tax income is $82,000 in Guelph versus $76,500 in Kitchener. Age: Guelph 40.1, Kitchener 39.
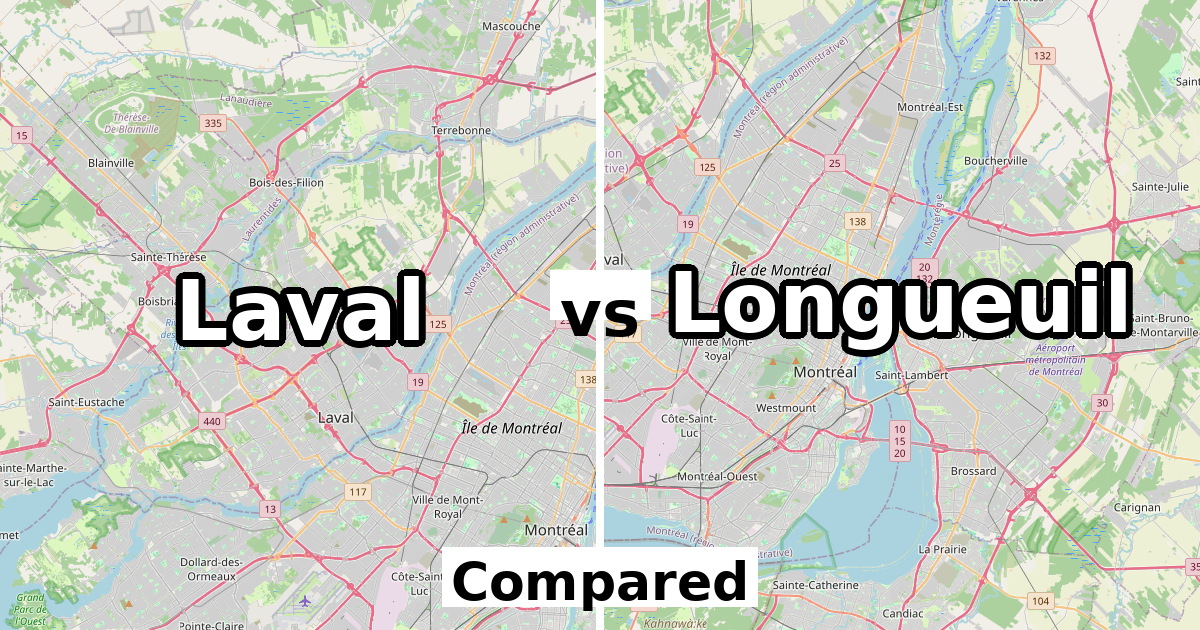
Laval vs Longueuil Population: 438,366 vs 254,483 + Income
Laval is bigger, but Longueuil grew faster (6.1% vs 3.6%). Median income is $73,500 in Laval and $62,000 in Longueuil. Average age: Laval 42, Longueuil 41.7.
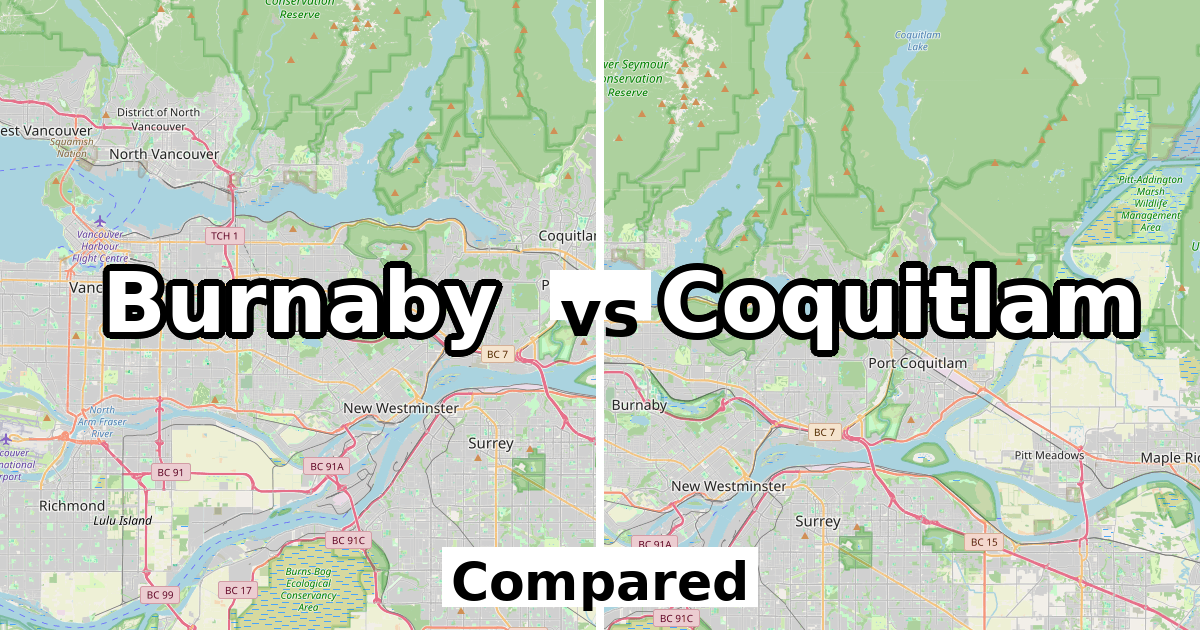
Burnaby vs Coquitlam Population: 249,125 vs 148,625 + Income
Burnaby is larger (249,125 vs 148,625). Median after-tax household income is $82,000 in Coquitlam and $73,500 in Burnaby. Age: Burnaby 42, Coquitlam 41.4.

Sherbrooke vs Trois-Rivières Population: 172,950 vs 139,163
Sherbrooke is larger and grew faster (7.2% vs 3.5%). Income is $55,200 in Sherbrooke and $53,600 in Trois-Rivières. Age: Sherbrooke 42.2, Trois-Rivières 45.8.
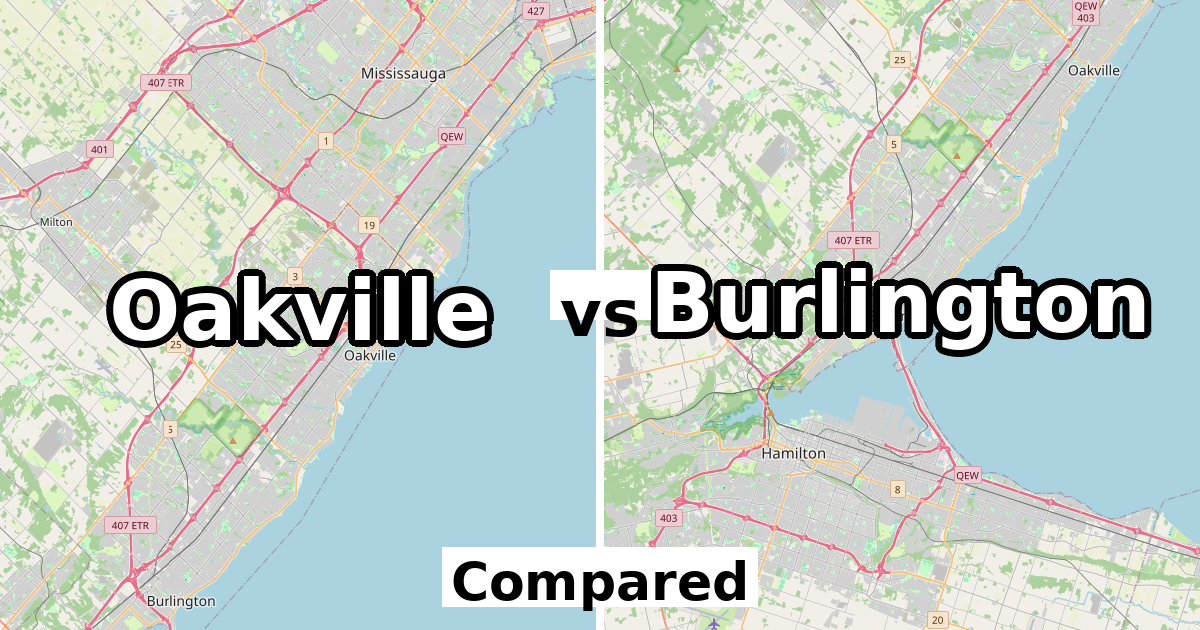
Oakville vs Burlington Population: 213,759 vs 186,948 + Income
Oakville is larger and grew faster (10.3% vs 2.0%). Median income is $108,000 in Oakville and $94,000 in Burlington. Age: Oakville 40.4, Burlington 43.3.
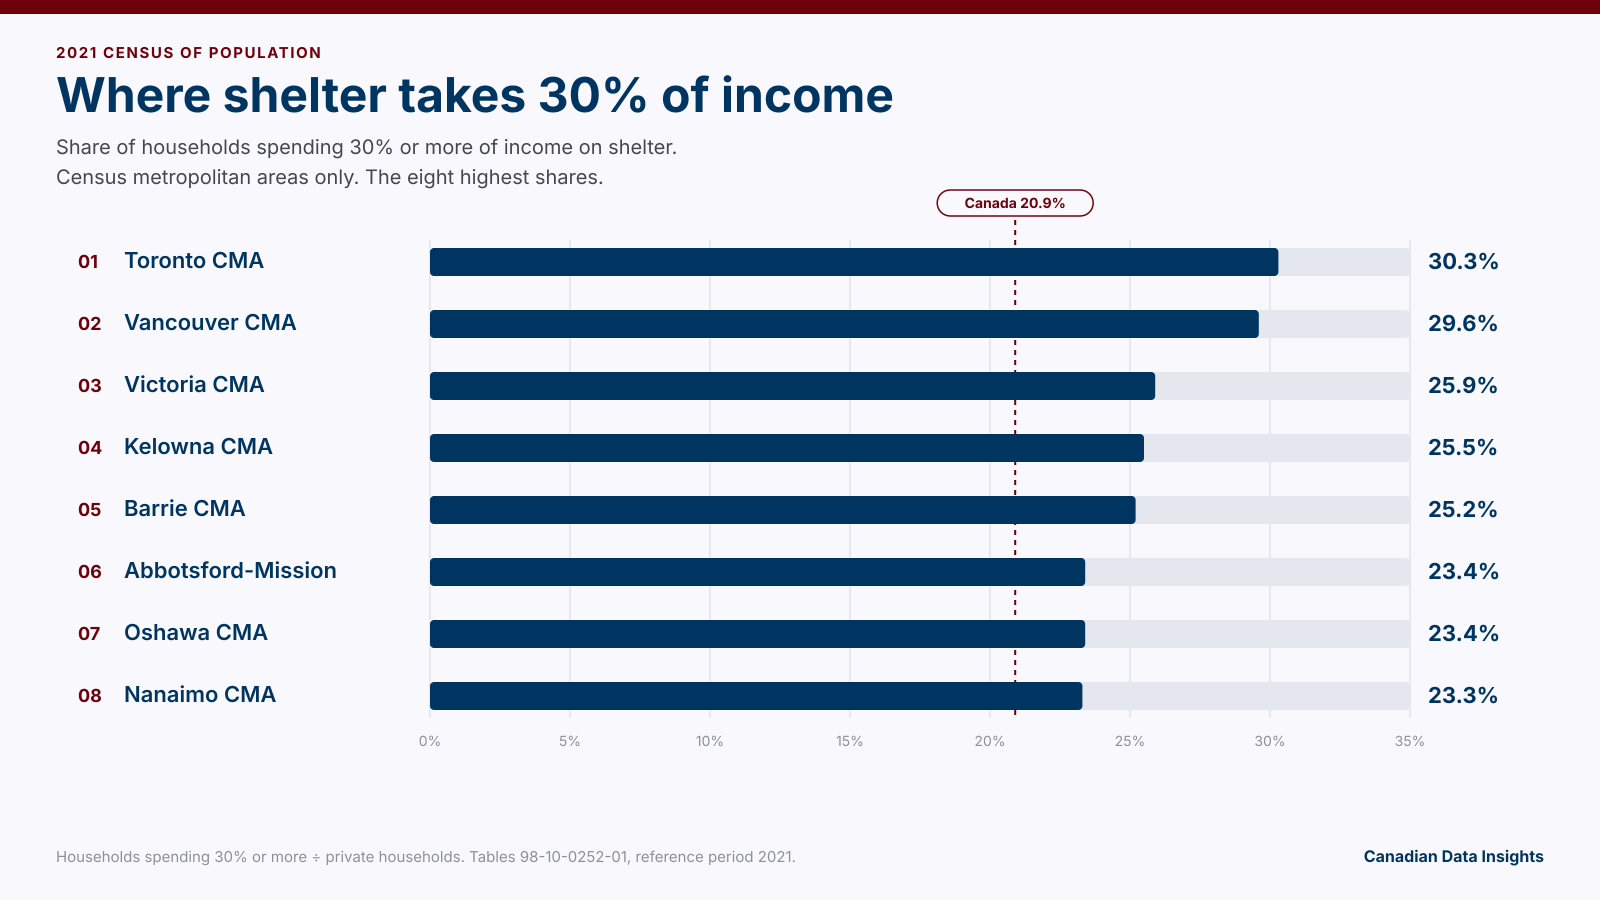
Who owns, who rents, and where shelter takes 30% of income
In the 2021 Census, 66.5% of Canada’s private households owned their home, and 20.9% spent 30% or more of income on shelter. Toronto (CMA) had the highest shelter burden of 41 census metropolitan areas, at 30.3%. Montréal (CMA) had the lowest owner share, at 54.4%.
September 2026 consumer prices: the monthly CPI pulse
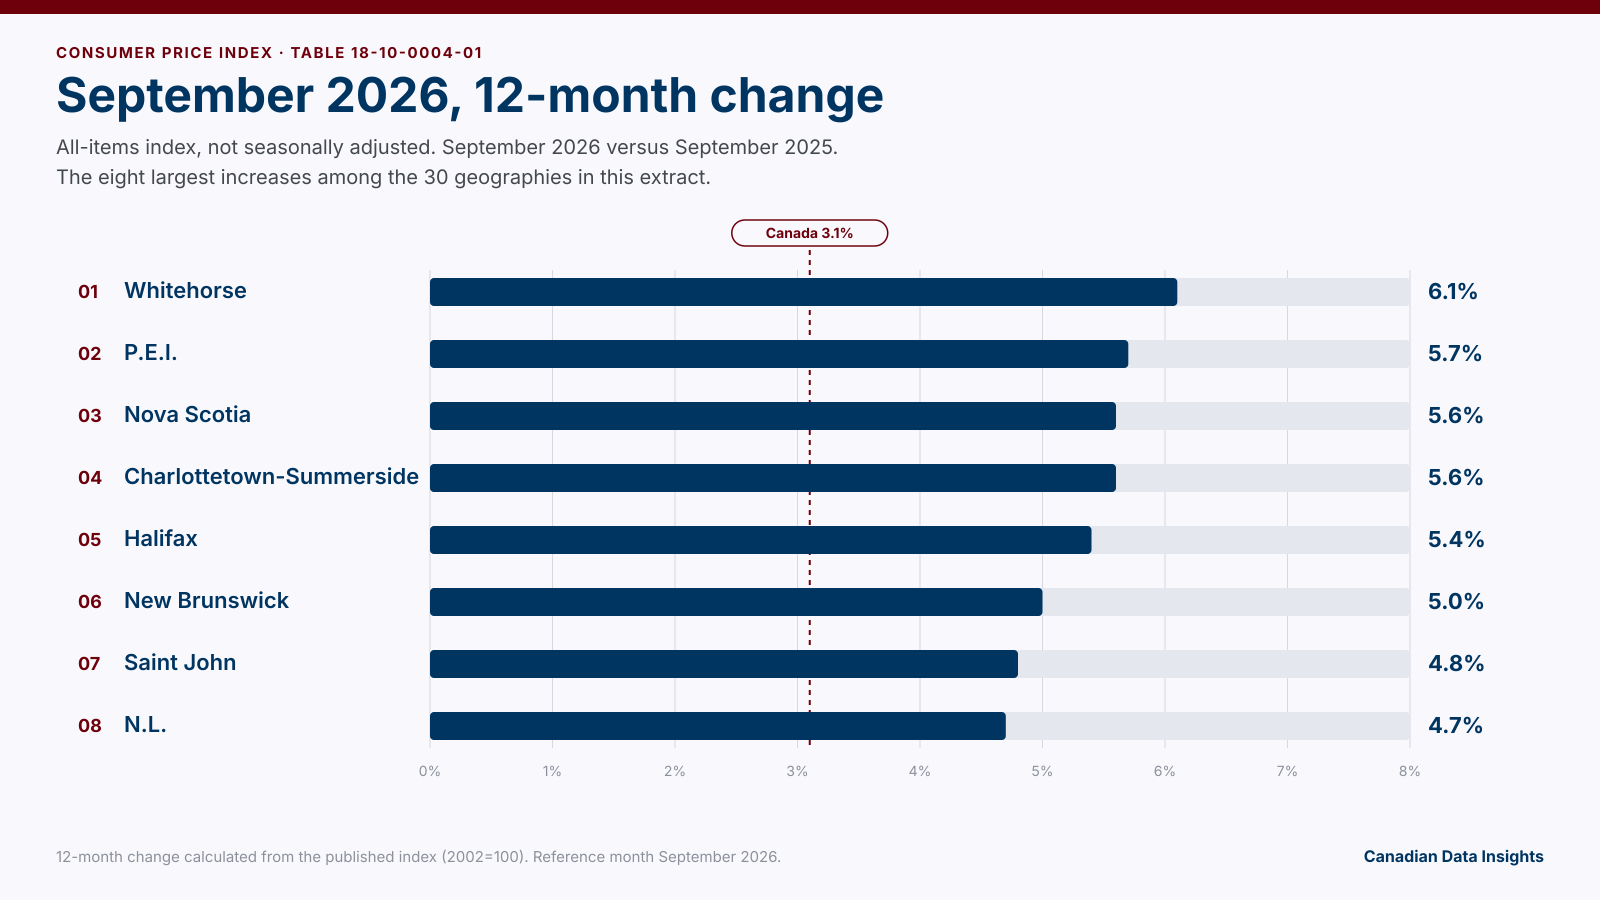
Canada’s all-items Consumer Price Index was 170.0 in September 2026, up 3.1% from September 2025. Whitehorse rose 6.1%, the largest 12-month increase among 30 geographies in this extract. Toronto, Ontario rose 2.1%, the smallest.
Toys R Us Returns Inside Staples. Canadian Toy Prices Are Still Below 2002 Levels
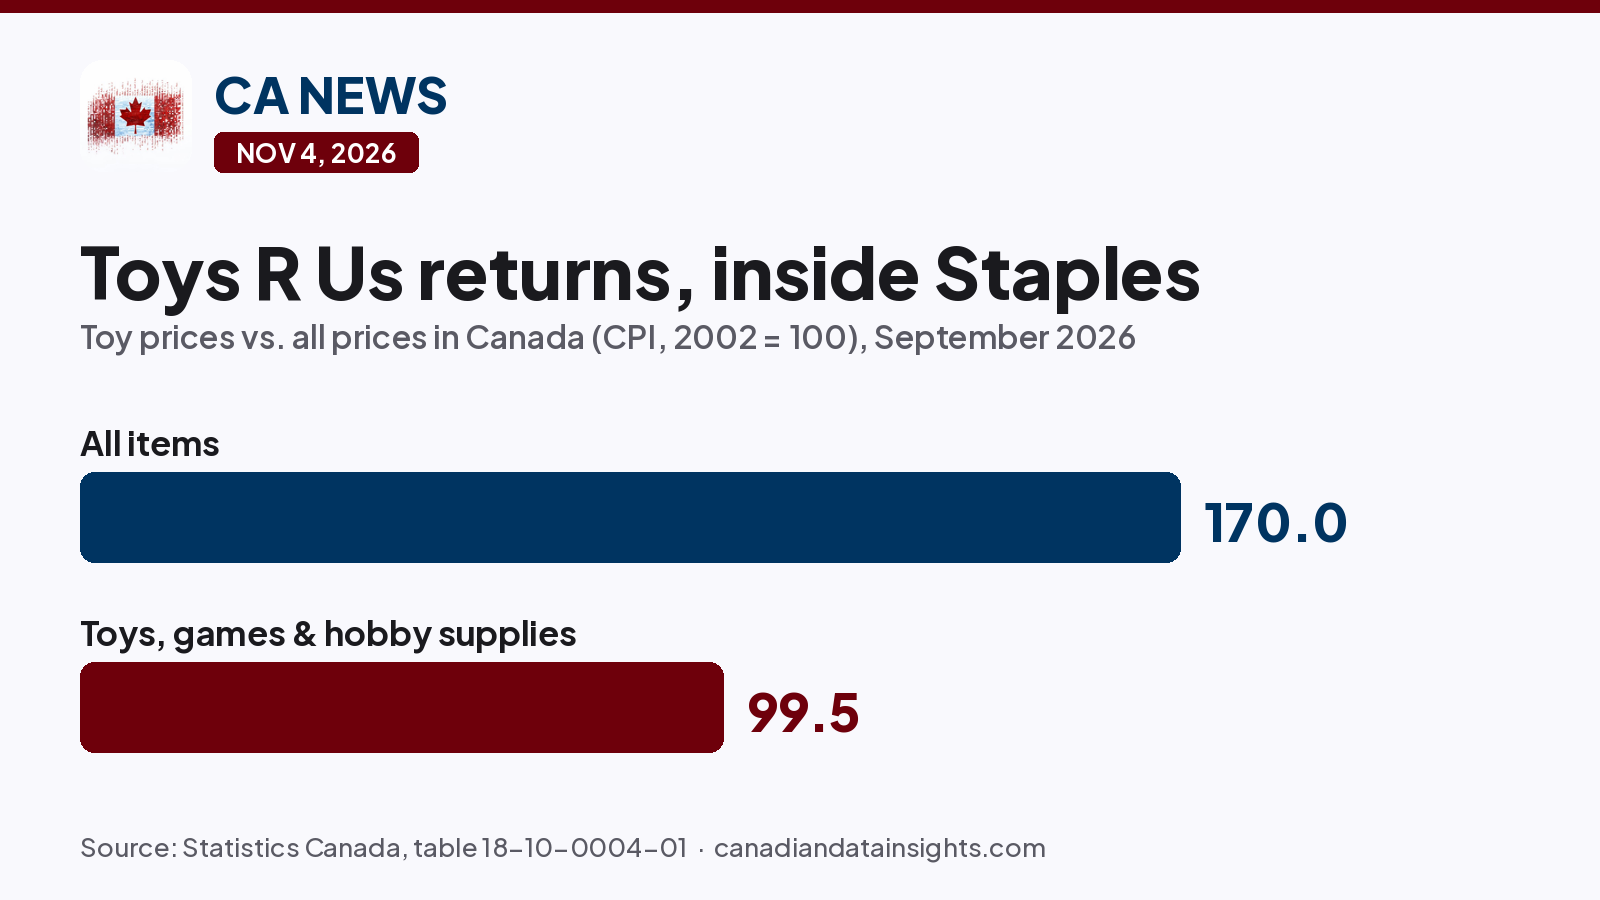
Toys R Us is coming back to Canada as shop-in-shops inside roughly 300 Staples stores, starting Nov. 14 in Richmond Hill. The data angle: Canada's price index for toys, games and hobby supplies is still slightly below its 2002 level, while overall prices are up 70%. What the deal is, why the old chain collapsed, and the numbers behind it.

Hackers Hit Europe's Supermarket Fridges. Canadians Spend $309 Million a Day at Grocery Stores
Canadians spent $9.58 billion at supermarkets and grocery stores in August 2026, about $309 million a day. Hackers just turned up the fridges at grocers in seven European countries. No Canadian store has been hit, but Canada's Cyber Centre has already logged tampering with control systems here. What happened, and the numbers behind it.

Metal in Halloween Candy: RCMP Investigate in Happy Valley-Goose Bay, One of N.L.'s Youngest Towns
17.5% of Happy Valley-Goose Bay residents are under 15, versus 13.4% across Newfoundland and Labrador. That's the town where RCMP are investigating three reports of small metal items in Halloween Coffee Crisp bars. What police know, what they advise, and the numbers behind it.

Canadian News Deep-Dives — November 1, 2026: Ebola's Canadian Angle, WestJet's Fuel Alarm, the Bridle Path Home Invasion
Three deep-dives: why Africa's top doctor, who lives in Canada, is asking Ottawa to do more as Ebola passes 10,000 cases; why WestJet says doubled jet fuel costs could hit fares; and what we know about the Bridle Path home invasion suspect wanted on a Canada-wide warrant.
Canada's industry map: oil & gas, healthcare and public-admin towns
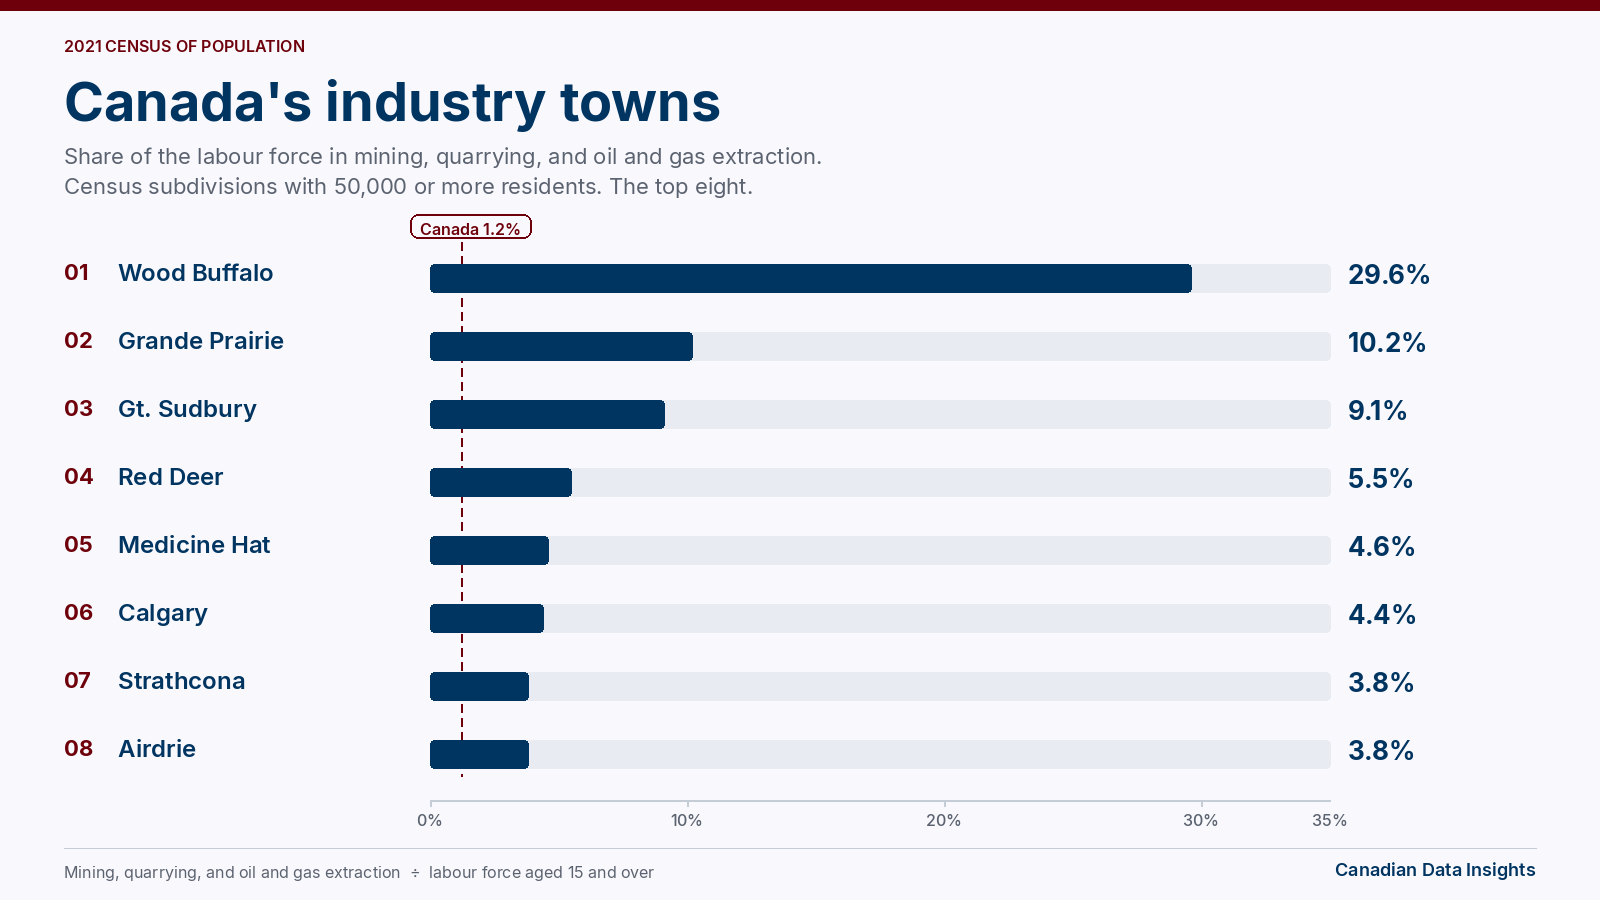
Wood Buffalo led Canadian places of 50,000 or more: 29.6% of the labour force worked in mining, quarrying, and oil and gas extraction. Thunder Bay led health care and social assistance, at 20.0%. Gatineau led public administration, at 26.2%. Canada was 1.2%, 12.7%, and 6.2%.

Canadian News Deep-Dives — October 31, 2026: Canada's EU 'Associate Member' Push, a Record El Niño Winter, Backstreet Boys Seat Refunds
Three deep-dives: what Canada actually got from the Canada-EU summit and what 'associate member' would mean, what a record 'super' El Niño means for your winter, and why Backstreet Boys fans in Toronto face a Nov. 22 refund-or-relocate choice.
Bachelor's vs trades: education mix by Canadian city (2021 Census)
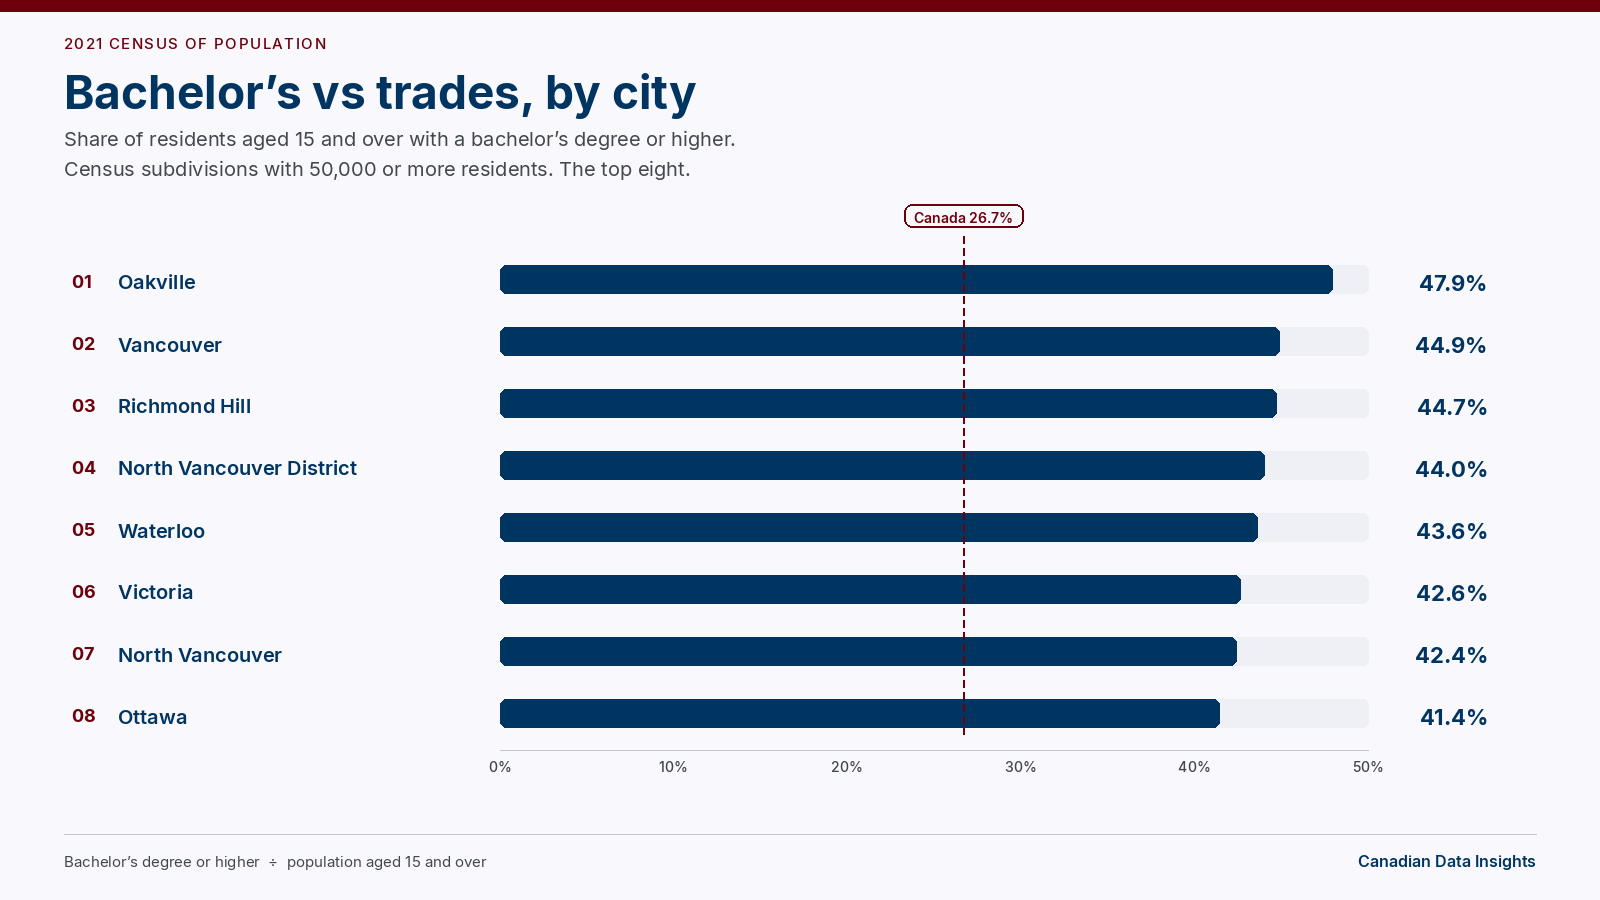
Oakville led Canadian places of 50,000 or more: 47.9% of residents aged 15 and over held a bachelor's degree or higher. Saguenay led on apprenticeship or trades certificates, at 23.2%. In nine of those places, trades certificates outnumber degrees. Canada was 26.7% and 8.7%.

Canadian News Deep-Dives — October 30, 2026: Ottawa's $1.6B Cohere Stake, 735 CRA Job Notices, Who Falls Back Nov. 1
Three deep-dives: why Ottawa is buying up to $1.6 billion of Toronto AI company Cohere and what it gets in return, what 735 workforce adjustment notices mean at the Canada Revenue Agency, and which Canadians will and won't turn their clocks back on Sunday.

Canada's Trades-Heavy Towns (2021 Census)
Wood Buffalo led Canadian places of 50,000 or more: 31.3% of the labour force was in trades, transport and equipment operators. Lac Ste. Anne County led places of 10,000 to 49,999, at 31.9%. The national share was 16.8%.

Canadian News Deep-Dives — October 29, 2026: Bank of Canada Hikes to 2.5%, Gillingham Wins Winnipeg, Rogers' 1.6% Card Fee
Three deep-dives: the Bank of Canada's first rate hike since 2023 and what a 4.70% prime means for borrowers, Scott Gillingham's second term and a remade Winnipeg council, and the 1.6% fee Rogers will add to credit card bill payments in January.
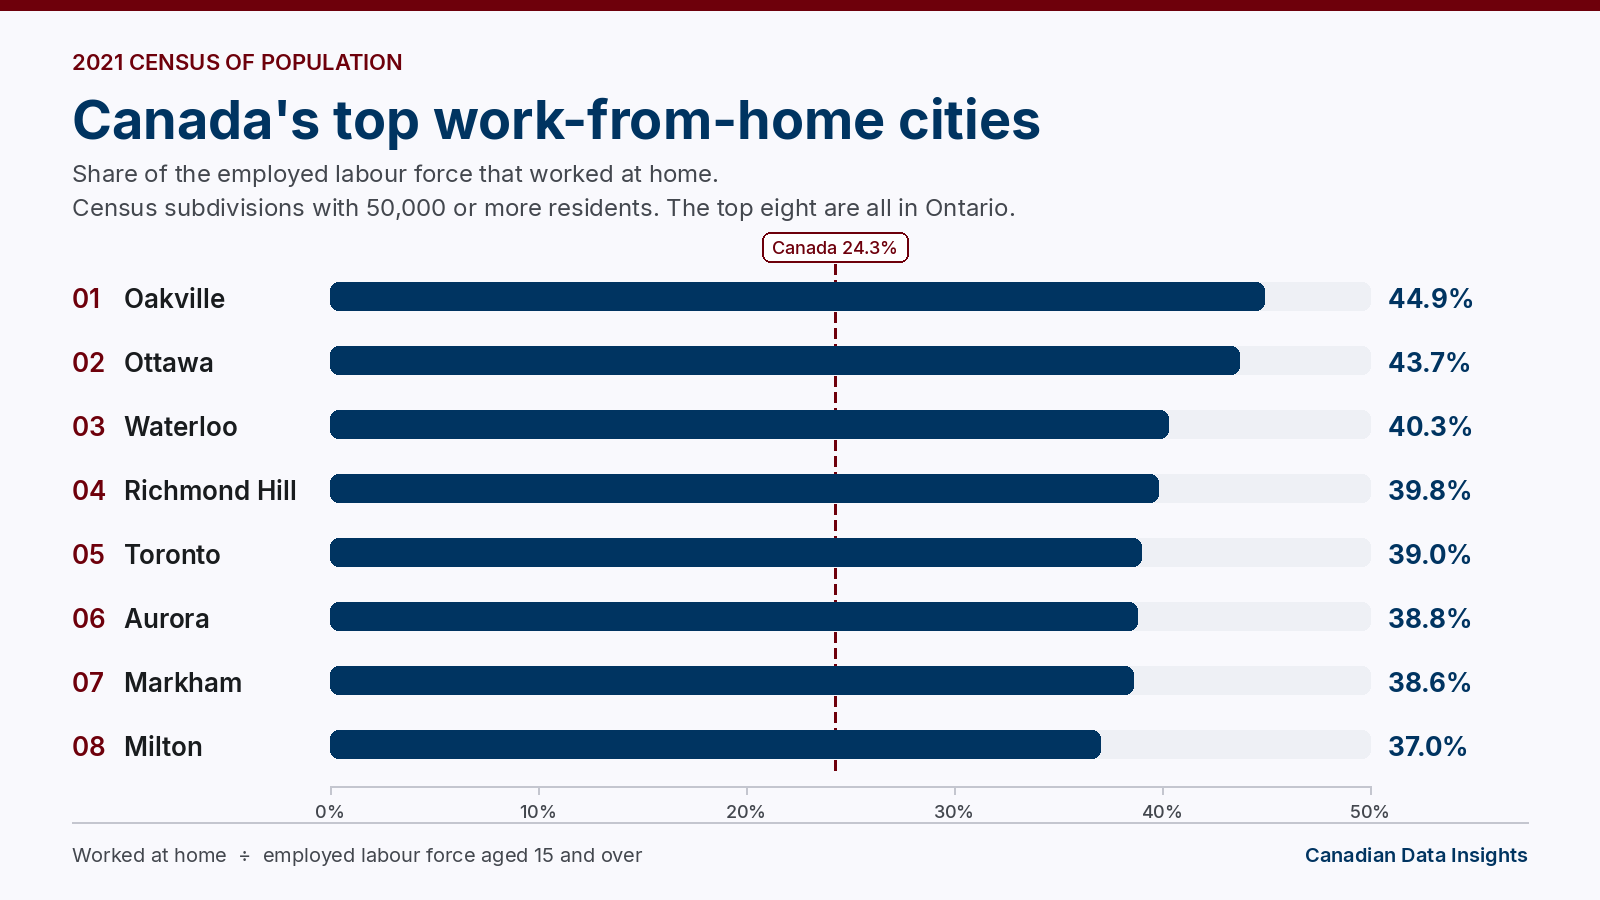
Canada's Top Work-from-Home Cities (2021 Census)
Oakville led Canadian places of 50,000 or more: 44.9% worked at home in the 2021 Census. The national share was 24.3%. See the top 15 and the lowest.

Canadian News Deep-Dives — October 28, 2026: $40M Lotto Max Ticket Expires, RBC Blocks AI Agents, Canada's First Eurovision Vote
Three deep-dives: a $40-million Lotto Max ticket sold in Grey County expires at the end of today, RBC becomes the first Canadian bank to block personal AI agents from online banking, and Canadians start voting on the country's first-ever Eurovision act.

Canadian News Deep-Dives — October 27, 2026: Chow Wins Again, Tedjo Takes Mississauga, the West Stops Falling Back
Three deep-dives: Olivia Chow wins a second term in Toronto with about 54% of the vote, Alvin Tedjo comes from fourth in the polls to beat Mississauga's current and former mayors, and Western Canada won't turn its clocks back on Nov. 1.

Canadian News Roundup — October 26, 2026: Ontario Votes, B.C. Turns Blue, Alberta Referendum Results
More than 11.8 million Ontarians can vote in today's municipal elections, the B.C. Conservatives won their first majority since 1928, Alberta's immigration questions passed, and the Bank of Canada decides on rates Wednesday.
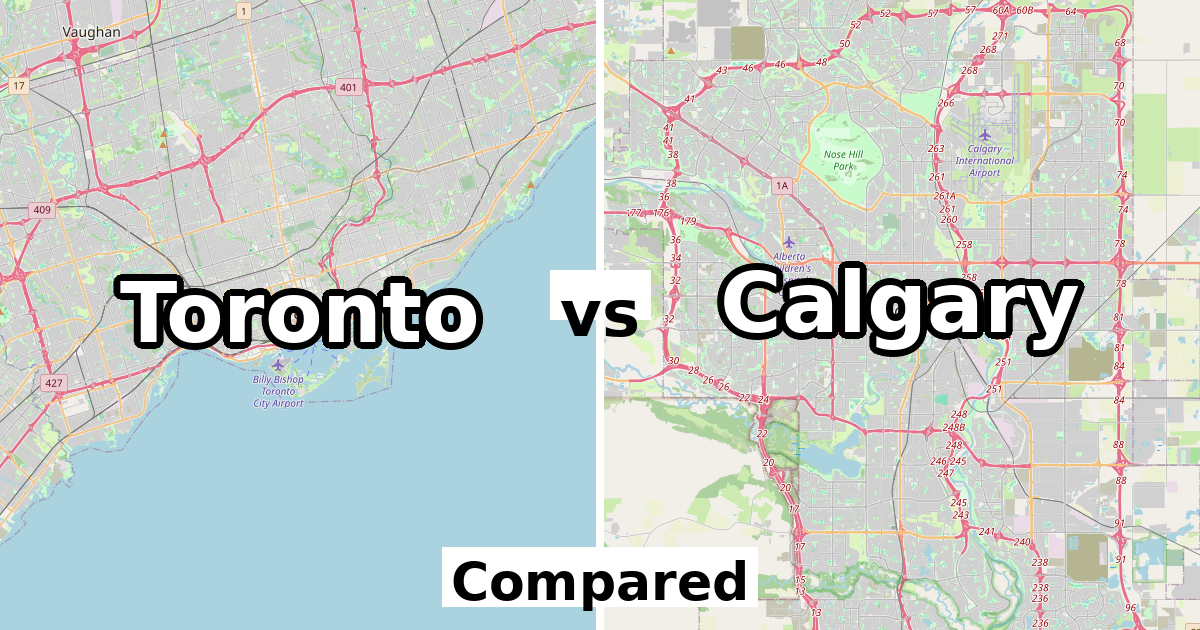
Toronto vs Calgary Population: 2,794,356 vs 1,306,784 + Income
Toronto is bigger, but Calgary grew faster (5.5% vs 2.3%). Median income is $85,000 in Calgary and $74,000 in Toronto. Average age: Toronto 41.5, Calgary 38.8.

Canada's Shift to Secondary Cities: 2016–2021 Trends
Analyzing how mid-sized Canadian cities outpaced major hubs in growth during the last census cycle, and what it means for the future of remote work.

The Income Breakdown: Exploring Regional Disparities
A side-by-side look at median household incomes and low-income prevalence across the provinces, revealing the hidden layers of Canadian prosperity.

Multicultural Horizons: The Languages Shaping Modern Canada
Moving beyond the English-French bilingual identity to look at the growth of non-official mother tongues and their impact on local communities.