
Bachelor's vs trades: education mix by Canadian city (2021 Census)
Oakville led Canadian places of 50,000 or more: 47.9% of residents aged 15 and over held a bachelor's degree or higher. Saguenay led on apprenticeship or trades certificates, at 23.2%. In nine of those places, trades certificates outnumber degrees. Canada was 26.7% and 8.7%.
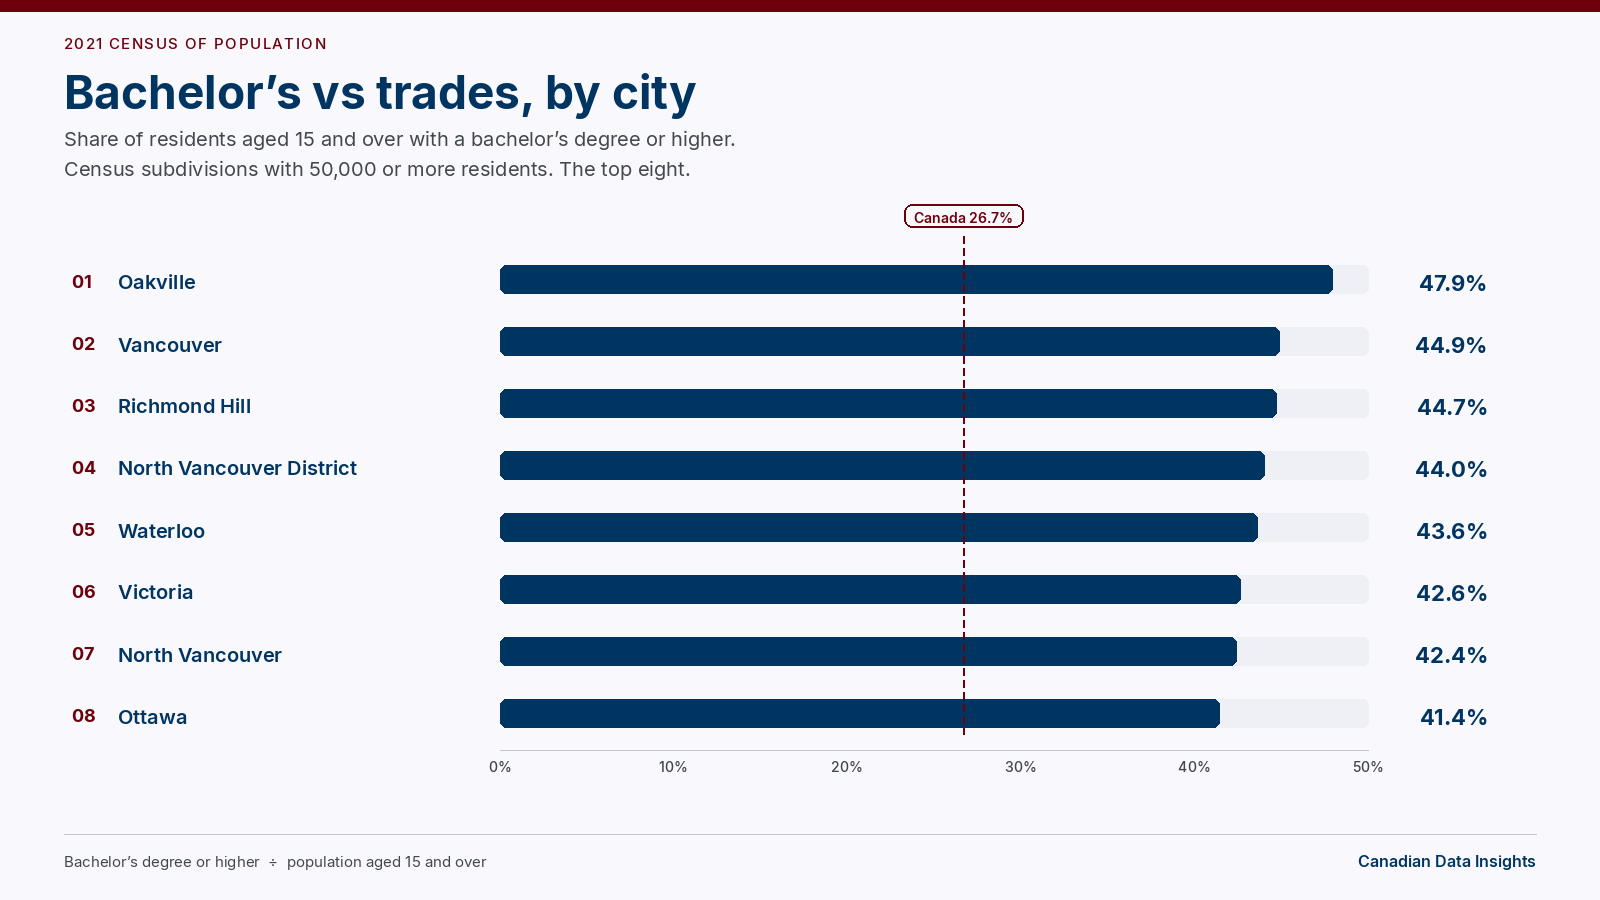
In the 2021 Census, 47.9% of Oakville residents aged 15 and over held a bachelor's degree or higher — the highest share among Canada's 101 census subdivisions with 50,000 or more residents. Vancouver was next, at 44.9%. Across Canada, the same share was 26.7%.
The other ranking uses the apprenticeship or trades certificate, and the same population. Saguenay led those 101 places, at 23.2%. Canada's share was 8.7%. In nine of the 101, trades certificates outnumber bachelor's degrees. All nine are in Quebec. A separate list further down covers places of 10,000 to 49,999. Westmount, at 19,658 residents, leads that smaller degree list, at 63.3%.
Both percentages divide a published count by the population aged 15 and over. Bachelor's degree or higher is one highest credential. Apprenticeship or trades certificate is another. A person is in one group, not both. College, CEGEP or other non-university certificate is a third group, and it is not inside either share. For Canada, that college share was 18.8% (5,714,490 of 30,335,915). The education section on each location page uses these same counts and the same denominator.
This is a different ranking from Canada's trades-heavy towns. That post counts people whose job was in trades, transport and equipment operators, as a share of the labour force. This post counts credentials, as a share of everyone aged 15 and over. Wood Buffalo led the occupation list, at 31.3% (13,345 of 42,655). On this credential list it is 13th, at 14.5% (8,025 of 55,245), and bachelor's degrees still outnumber trades certificates there (10,790 and 8,025).
Statistics Canada randomly rounds census counts, so a set of categories can miss its published total by a few people. For Canada, the four published parts of postsecondary — trades certificate, college or CEGEP, university certificate below the bachelor level, and bachelor's or higher — add up to the postsecondary total of 17,339,045. This page does not adjust municipal rows for rounding, and it does not estimate any remainder.
Places of 50,000 or more: bachelor's degree or higher
The ranking below keeps the list to census subdivisions — cities, towns, and other municipalities — with a 2021 population of at least 50,000. That threshold leaves 101 places. Every figure is calculated from the census counts in this site's location file. Nine of the top 15 are in Ontario, five are in British Columbia, and one is in New Brunswick.
Toronto does not lead the share. It has the largest bachelor's count in the group of 101: 976,620 people.
| Rank | Place | Province | Population | Bachelor's or higher | Trades certificate | Aged 15+ | Bachelor's share | Trades share |
|---|---|---|---|---|---|---|---|---|
| 1 | Oakville | Ontario | 213,759 | 83,230 | 4,910 | 173,625 | 47.9% | 2.8% |
| 2 | Vancouver | British Columbia | 662,248 | 260,240 | 24,410 | 580,010 | 44.9% | 4.2% |
| 3 | Richmond Hill | Ontario | 202,022 | 76,510 | 5,260 | 170,980 | 44.7% | 3.1% |
| 4 | North Vancouver District | British Columbia | 88,168 | 32,065 | 3,850 | 72,820 | 44.0% | 5.3% |
| 5 | Waterloo | Ontario | 121,436 | 43,915 | 3,185 | 100,820 | 43.6% | 3.2% |
| 6 | Victoria | British Columbia | 91,867 | 33,860 | 4,320 | 79,470 | 42.6% | 5.4% |
| 7 | North Vancouver | British Columbia | 58,120 | 21,280 | 2,965 | 50,205 | 42.4% | 5.9% |
| 8 | Ottawa | Ontario | 1,017,449 | 345,465 | 29,735 | 834,135 | 41.4% | 3.6% |
| 9 | Toronto | Ontario | 2,794,356 | 976,620 | 80,935 | 2,377,950 | 41.1% | 3.4% |
| 10 | Aurora | Ontario | 62,057 | 20,715 | 1,785 | 50,830 | 40.8% | 3.5% |
| 11 | Milton | Ontario | 132,979 | 40,300 | 3,505 | 99,460 | 40.5% | 3.5% |
| 12 | Markham | Ontario | 338,503 | 111,165 | 7,030 | 283,405 | 39.2% | 2.5% |
| 13 | Fredericton | New Brunswick | 63,116 | 20,220 | 2,515 | 52,730 | 38.3% | 4.8% |
| 14 | Burnaby | British Columbia | 249,125 | 81,580 | 10,870 | 213,475 | 38.2% | 5.1% |
| 15 | Mississauga | Ontario | 717,961 | 230,635 | 22,470 | 603,595 | 38.2% | 3.7% |
Shares are shown to one decimal place, matching the location pages. Burnaby (81,580 of 213,475) ranks just ahead of Mississauga (230,635 of 603,595). Both round to 38.2%.
North Vancouver District in this table is the district municipality, population 88,168. North Vancouver is the city, population 58,120, at 42.4% (21,280 of 50,205). Waterloo is the city of 121,436, not a regional total. Fredericton is the one Atlantic place in the top 15, at 38.3% (20,220 of 52,730). New Brunswick as a whole was 19.0% (122,865 of 648,245).
Apprenticeship or trades certificate
The same 101 places, ranked the other way. The top 12 are in Quebec, and 14 of the top 15 are. Wood Buffalo is the one place outside Quebec in that top 15.
Montréal does not lead the share. It has the largest trades-certificate count in the group of 101: 135,320 people. Its bachelor's count is larger still, at 522,915.
| Rank | Place | Province | Population | Bachelor's or higher | Trades certificate | Aged 15+ | Bachelor's share | Trades share |
|---|---|---|---|---|---|---|---|---|
| 1 | Saguenay | Quebec | 144,723 | 20,985 | 27,700 | 119,590 | 17.5% | 23.2% |
| 2 | Mirabel | Quebec | 61,108 | 7,055 | 10,485 | 48,245 | 14.6% | 21.7% |
| 3 | Mascouche | Quebec | 51,183 | 6,190 | 8,475 | 39,930 | 15.5% | 21.2% |
| 4 | Drummondville | Quebec | 79,258 | 8,710 | 12,525 | 64,035 | 13.6% | 19.6% |
| 5 | Terrebonne | Quebec | 119,944 | 15,170 | 18,230 | 94,250 | 16.1% | 19.3% |
| 6 | Saint-Jean-sur-Richelieu | Quebec | 97,873 | 12,265 | 14,835 | 79,075 | 15.5% | 18.8% |
| 7 | Repentigny | Quebec | 86,100 | 12,230 | 12,515 | 69,450 | 17.6% | 18.0% |
| 8 | Saint-Hyacinthe | Quebec | 57,239 | 6,540 | 8,285 | 46,350 | 14.1% | 17.9% |
| 9 | Trois-Rivières | Quebec | 139,163 | 22,550 | 20,005 | 114,125 | 19.8% | 17.5% |
| 10 | Granby | Quebec | 69,025 | 7,405 | 9,680 | 56,025 | 13.2% | 17.3% |
| 11 | Lévis | Quebec | 149,683 | 29,765 | 20,365 | 121,095 | 24.6% | 16.8% |
| 12 | Sherbrooke | Quebec | 172,950 | 34,895 | 23,115 | 139,990 | 24.9% | 16.5% |
| 13 | Wood Buffalo | Alberta | 72,326 | 10,790 | 8,025 | 55,245 | 19.5% | 14.5% |
| 14 | Blainville | Quebec | 59,819 | 11,665 | 6,900 | 48,010 | 24.3% | 14.4% |
| 15 | Québec | Quebec | 549,459 | 132,100 | 64,890 | 452,695 | 29.2% | 14.3% |
Québec (64,890 of 452,695) ranks just ahead of Longueuil (29,680 of 207,820). Both round to 14.3%. Longueuil is 16th, just outside the table. Québec in that sentence is the city, not the province.
A high trades-certificate share is not the same fact as trades certificates outnumbering degrees. Trois-Rivières is 9th on this list, at 17.5% (20,005 of 114,125), and bachelor's degrees are still higher, at 19.8% (22,550 of 114,125). Wood Buffalo, 13th here, is the same kind of case: 10,790 bachelor's degrees and 8,025 trades certificates.
College or CEGEP stays near the national share inside this top 10. It runs from 16.2% in Saint-Hyacinthe (7,530 of 46,350) to 19.8% in Saguenay (23,725 of 119,590). Canada is 18.8%. Trades-certificate shares in the same ten places run from 17.3% to 23.2%, above Canada's 8.7%.
Where trades certificates outnumber degrees
Nine of the 101 places have more residents whose highest credential is an apprenticeship or trades certificate than residents whose highest credential is a bachelor's degree or higher. All nine are in Quebec. The ratio is the trades-certificate count divided by the bachelor's-or-higher count, shown to two decimal places.
| Rank | Place | Province | Population | Trades certificate | Bachelor's or higher | Trades per degree | Trades share | Bachelor's share |
|---|---|---|---|---|---|---|---|---|
| 1 | Mirabel | Quebec | 61,108 | 10,485 | 7,055 | 1.49 | 21.7% | 14.6% |
| 2 | Drummondville | Quebec | 79,258 | 12,525 | 8,710 | 1.44 | 19.6% | 13.6% |
| 3 | Mascouche | Quebec | 51,183 | 8,475 | 6,190 | 1.37 | 21.2% | 15.5% |
| 4 | Saguenay | Quebec | 144,723 | 27,700 | 20,985 | 1.32 | 23.2% | 17.5% |
| 5 | Granby | Quebec | 69,025 | 9,680 | 7,405 | 1.31 | 17.3% | 13.2% |
| 6 | Saint-Hyacinthe | Quebec | 57,239 | 8,285 | 6,540 | 1.27 | 17.9% | 14.1% |
| 7 | Saint-Jean-sur-Richelieu | Quebec | 97,873 | 14,835 | 12,265 | 1.21 | 18.8% | 15.5% |
| 8 | Terrebonne | Quebec | 119,944 | 18,230 | 15,170 | 1.20 | 19.3% | 16.1% |
| 9 | Repentigny | Quebec | 86,100 | 12,515 | 12,230 | 1.02 | 18.0% | 17.6% |
Mirabel is the widest gap, at 1.49 trades certificates for every bachelor's degree or higher (10,485 and 7,055). Repentigny is the narrowest. Trades certificates lead by 285 people (12,515 and 12,230), a ratio of 1.02.
The other end of the same ratio is a degree-heavy suburb. In Oakville there are 16.95 people with a bachelor's degree or higher for every trades certificate (83,230 and 4,910). Markham is next, at 15.81 (111,165 and 7,030). Richmond Hill is third, at 14.55 (76,510 and 5,260). Canada is 3.06 (8,086,245 and 2,641,555).
Markham has the lowest trades-certificate share in the group of 101, at 2.5%. Oakville is second-lowest, at 2.8%, and first on the bachelor's share. Oakville also led the worked-at-home ranking in Canada's top work-from-home cities, and it was last on the occupation list in the trades-towns post, at 9.0% (10,235 of 113,190). The three rankings use different census questions. Worked at home is a share of the employed labour force. The occupation share uses the labour force. This post uses the population aged 15 and over.
Where the largest cities land
Five census subdivisions in the file have 1,000,000 residents or more. Ottawa is 8th on bachelor's degrees, at 41.4% (345,465 of 834,135), and 94th on trades certificates, at 3.6% (29,735 of 834,135). Toronto is 9th and 97th, at 41.1% and 3.4%. Montréal is 19th and 30th, at 36.0% (522,915 of 1,453,295) and 9.3% (135,320 of 1,453,295). Calgary is 22nd and 64th, at 35.7% (377,450 of 1,056,230) and 5.9% (62,155 of 1,056,230). Edmonton is 34th and 42nd, at 29.7% (241,480 of 812,610) and 7.3% (59,580 of 812,610).
Winnipeg, at 749,607 residents, is 37th on bachelor's degrees, at 29.2% (178,745 of 612,550), and 68th on trades certificates, at 5.7% (34,885 of 612,550). Vancouver is already in the first table: 2nd on bachelor's degrees and 88th on trades certificates, at 4.2% (24,410 of 580,010).
The low end of the 50,000-person list
Norfolk County is last on bachelor's degrees among the 101 places, at 12.5%. The five lowest:
| Rank | Place | Province | Population | Bachelor's or higher | Trades certificate | Aged 15+ | Bachelor's share | Trades share |
|---|---|---|---|---|---|---|---|---|
| 97 | Drummondville | Quebec | 79,258 | 8,710 | 12,525 | 64,035 | 13.6% | 19.6% |
| 98 | Kawartha Lakes | Ontario | 79,247 | 8,985 | 5,420 | 66,700 | 13.5% | 8.1% |
| 99 | Granby | Quebec | 69,025 | 7,405 | 9,680 | 56,025 | 13.2% | 17.3% |
| 100 | Chatham-Kent | Ontario | 103,988 | 11,030 | 5,500 | 85,225 | 12.9% | 6.5% |
| 101 | Norfolk County | Ontario | 67,490 | 6,975 | 4,405 | 55,980 | 12.5% | 7.9% |
Last on bachelor's degrees is not the same fact as the smallest postsecondary share. Norfolk County's postsecondary share is 47.2% (26,410 of 55,980), below Canada's 57.2% (17,339,045 of 30,335,915). Its college share is 25.5% (14,250 of 55,980), above Canada's 18.8%. Kawartha Lakes is 98th on bachelor's degrees and 37th on trades certificates, at 8.1% (5,420 of 66,700). Its college share is 26.0% (17,330 of 66,700), and its postsecondary share is 49.0% (32,655 of 66,700).
Those two places sat near the top of the occupation ranking. Kawartha Lakes was 2nd, at 24.7% of the labour force (9,030 of 36,500). Norfolk County was 3rd, at 24.3% (7,685 of 31,620). Their trades-certificate shares, 8.1% and 7.9%, sit near Canada's 8.7%. A job in the trades and a trades certificate as one's highest credential are different census facts.
On the trades-certificate ranking, Markham is last, at 2.5% (7,030 of 283,405). Then Oakville at 2.8%, Richmond Hill at 3.1% (5,260 of 170,980), Waterloo at 3.2% (3,185 of 100,820), and Toronto at 3.4% (80,935 of 2,377,950). Milton (3,505 of 99,460) ranks just ahead of Aurora (1,785 of 50,830). Both round to 3.5%. Toronto's trades-certificate count is still the second-largest in the group of 101, after Montréal.
The national figure
For Canada, 8,086,245 people held a bachelor's degree or higher out of a population aged 15 and over of 30,335,915, which is 26.7%. The trades-certificate count was 2,641,555, which is 8.7%. The country's 2021 population was 36,991,981. That Canada figure is the country's published counts in the location file. It is not the sum of the municipal rows above.
High school diploma or equivalency also rounds to 26.7%, from a larger count: 8,097,295 of 30,335,915. The two groups are different people. Postsecondary credentials, the wider group that contains both degrees and trades certificates, were 57.2% (17,339,045 of 30,335,915).
Among the 101 places of 50,000 or more, the median bachelor's share was 24.9%. Laval holds that middle place, 51st, at 24.9% (88,110 of 354,415). Sherbrooke ranks just ahead, 50th, and also rounds to 24.9% (34,895 of 139,990). The median trades-certificate share was 6.7%. Halifax holds that middle place, at 6.7% (24,760 of 370,355). Halifax here is the regional municipality, population 439,819.
On the one-decimal shares used in the tables, 41 places round above Canada's 26.7% on bachelor's degrees, St. Albert rounds to the same 26.7% (14,620 of 54,675), and 59 round lower. On trades certificates, 32 places round above Canada's 8.7%, three round to the same 8.7% — Kelowna (10,650 of 122,175), Port Coquitlam (4,410 of 50,770), and Sarnia (5,240 of 60,375) — and 66 round lower.
Added together, those 101 places had 6,296,965 people with a bachelor's degree or higher out of 19,837,945 aged 15 and over, a combined share of 31.7%. The trades-certificate combined share was 6.9% (1,360,125 of 19,837,945). The median counts each municipality once. The combined share counts every person aged 15 and over, so large places with high degree shares — Toronto, Montréal, Vancouver, and Ottawa — pull the bachelor's figure above both the median and the Canada figure. The same large places pull the trades-certificate figure below Canada. The 314 places of 10,000 to 49,999 combine to 20.2% on bachelor's degrees (1,047,655 of 5,185,495) and 10.7% on trades certificates (556,215 of 5,185,495).
Ontario was the highest province or territory on bachelor's degrees, at 29.9% (3,528,600 of 11,782,820). Nunavut was the lowest, at 10.6% (2,605 of 24,535). Among provinces, Newfoundland and Labrador was the lowest, at 16.6% (72,190 of 433,960). On trades certificates, Quebec was the highest, at 15.8% (1,096,360 of 6,918,730), and its bachelor's share was 23.5% (1,628,940 of 6,918,730). Ontario was the lowest on trades certificates, at 5.0% (592,485 of 11,782,820). Nunavut also rounds to 5.0% (1,235 of 24,535). Ontario's unrounded share is slightly lower. Alberta rounds to the same 8.7% as Canada (295,285 of 3,375,135).
Places of 10,000 to 49,999
Dropping the floor to 10,000 residents, and stopping below 50,000, leaves 314 census subdivisions. Six of them post a higher bachelor's share than Oakville. Westmount is first, at 63.3% (10,415 of 16,450). The top eight are below. Five are in Quebec, two in British Columbia, and one in Alberta.
| Rank | Place | Province | Population | Bachelor's or higher | Trades certificate | Aged 15+ | Bachelor's share | Trades share |
|---|---|---|---|---|---|---|---|---|
| 1 | Westmount | Quebec | 19,658 | 10,415 | 345 | 16,450 | 63.3% | 2.1% |
| 2 | Mont-Royal | Quebec | 20,953 | 9,855 | 450 | 16,430 | 60.0% | 2.7% |
| 3 | Oak Bay District | British Columbia | 17,990 | 8,145 | 585 | 15,345 | 53.1% | 3.8% |
| 4 | Saint-Lambert | Quebec | 22,761 | 9,530 | 945 | 18,380 | 51.8% | 5.1% |
| 5 | Beaconsfield | Quebec | 19,277 | 7,915 | 525 | 15,570 | 50.8% | 3.4% |
| 6 | West Vancouver District | British Columbia | 44,122 | 18,635 | 1,275 | 37,225 | 50.1% | 3.4% |
| 7 | Kirkland | Quebec | 19,413 | 7,025 | 780 | 16,170 | 43.4% | 4.8% |
| 8 | Canmore | Alberta | 15,990 | 5,745 | 905 | 13,485 | 42.6% | 6.7% |
The trades-certificate list for the same population band is not a second copy of the big-city ranking. Saint-Lin--Laurentides is first, at 28.4% (5,185 of 18,245), above Saguenay's 23.2%. Its bachelor's share is 5.0% (905 of 18,245). The top 10 are all in Quebec. Saint-Lin--Laurentides was also second on the occupation ranking in the trades-towns post.
| Rank | Place | Province | Population | Bachelor's or higher | Trades certificate | Aged 15+ | Bachelor's share | Trades share |
|---|---|---|---|---|---|---|---|---|
| 1 | Saint-Lin--Laurentides | Quebec | 24,030 | 905 | 5,185 | 18,245 | 5.0% | 28.4% |
| 2 | Sainte-Sophie | Quebec | 18,080 | 1,145 | 3,980 | 14,095 | 8.1% | 28.2% |
| 3 | Sainte-Julienne | Quebec | 11,173 | 665 | 2,425 | 8,840 | 7.5% | 27.4% |
| 4 | Saint-Raymond | Quebec | 11,108 | 910 | 2,390 | 9,010 | 10.1% | 26.5% |
| 5 | Saint-Colomban | Quebec | 17,740 | 1,800 | 3,590 | 13,650 | 13.2% | 26.3% |
| 6 | Saint-Félicien | Quebec | 10,089 | 1,115 | 2,110 | 8,315 | 13.4% | 25.4% |
| 7 | Dolbeau-Mistassini | Quebec | 13,718 | 1,275 | 2,735 | 11,065 | 11.5% | 24.7% |
| 8 | Lavaltrie | Quebec | 14,425 | 1,040 | 2,850 | 11,575 | 9.0% | 24.6% |
| 9 | Beauharnois | Quebec | 13,638 | 1,235 | 2,780 | 11,295 | 10.9% | 24.6% |
| 10 | Saint-Hippolyte | Quebec | 10,669 | 1,405 | 2,180 | 8,880 | 15.8% | 24.5% |
Lavaltrie (2,850 of 11,575) ranks just ahead of Beauharnois (2,780 of 11,295). Both round to 24.6%.
Random rounding moves a share more when the population aged 15 and over is small. Saint-Lin--Laurentides' denominator is 18,245 people. Saguenay's is 119,590, and Toronto's is 2,377,950. A few people rounded into or out of a count change the first decimal in the smaller place and do not change it in the larger one. The ranks above use the published counts as stored.
Movers, parents, and career changers
A mover comparing cities is looking at the credentials of people aged 15 and over who already live there. Hiring rules and job postings sit outside this census question. Oakville and Saguenay answer different questions: 47.9% with a bachelor's degree or higher in Oakville, 23.2% with a trades certificate in Saguenay. Burlington, next door to Oakville, is 35.6% (54,880 of 154,075) on bachelor's degrees and 4.3% (6,550 of 154,075) on trades certificates. The paired write-ups are Oakville vs Burlington, Toronto vs Vancouver, Montréal vs Québec, and Sherbrooke vs Trois-Rivières.
A parent reading a "most educated" list is reading one credential. The census records the highest certificate, diploma, or degree of residents aged 15 and over. Norfolk County is last on bachelor's degrees, at 12.5%, with a college share of 25.5%, above the Canada figure. Its postsecondary share, 47.2%, remains below Canada's 57.2%.
Someone changing fields can read the ratio the same way: which credential is more common among the adults already there. Oakville has 16.95 bachelor's degrees for every trades certificate. Mirabel has 1.49 trades certificates for every bachelor's degree. Canada has 3.06. Classroom seats and current job openings sit outside this table. A trades certificate, a college or CEGEP diploma, and a bachelor's degree are three different highest credentials in the same count. The location page has the rest of the breakdown.
Compare a place yourself
Open any linked place for the full education breakdown, or set two places side by side in the comparison tool. The education, commute, occupation, and industry sections use the same anchors on location pages and in that tool. The worked-at-home ranking is in Canada's top work-from-home cities. The occupation ranking is in Canada's trades-heavy towns.
Sources
Education counts, including bachelor's degree or higher, apprenticeship or trades certificate, college or CEGEP, and the population aged 15 and over, plus population and the occupation counts cited for comparison, are from the Statistics Canada 2021 Census of Population (Census Profile), as stored for each place in the Canadian Data Insights location file. Shares on this page are calculated here from those published counts. See how this site handles census data. Statistics Canada data is used under the Open Government Licence – Canada. This post is by Andrew.
Bachelor's degree or higher, places of 50,000 or more (percent)
Source: Statistics Canada, 2021 Census of Population
Data source → Census methodology & attribution
Back to All Insights