
September 2026 consumer prices: the monthly CPI pulse
Canada’s all-items Consumer Price Index was 170.0 in September 2026, up 3.1% from September 2025. Whitehorse rose 6.1%, the largest 12-month increase among 30 geographies in this extract. Toronto, Ontario rose 2.1%, the smallest.
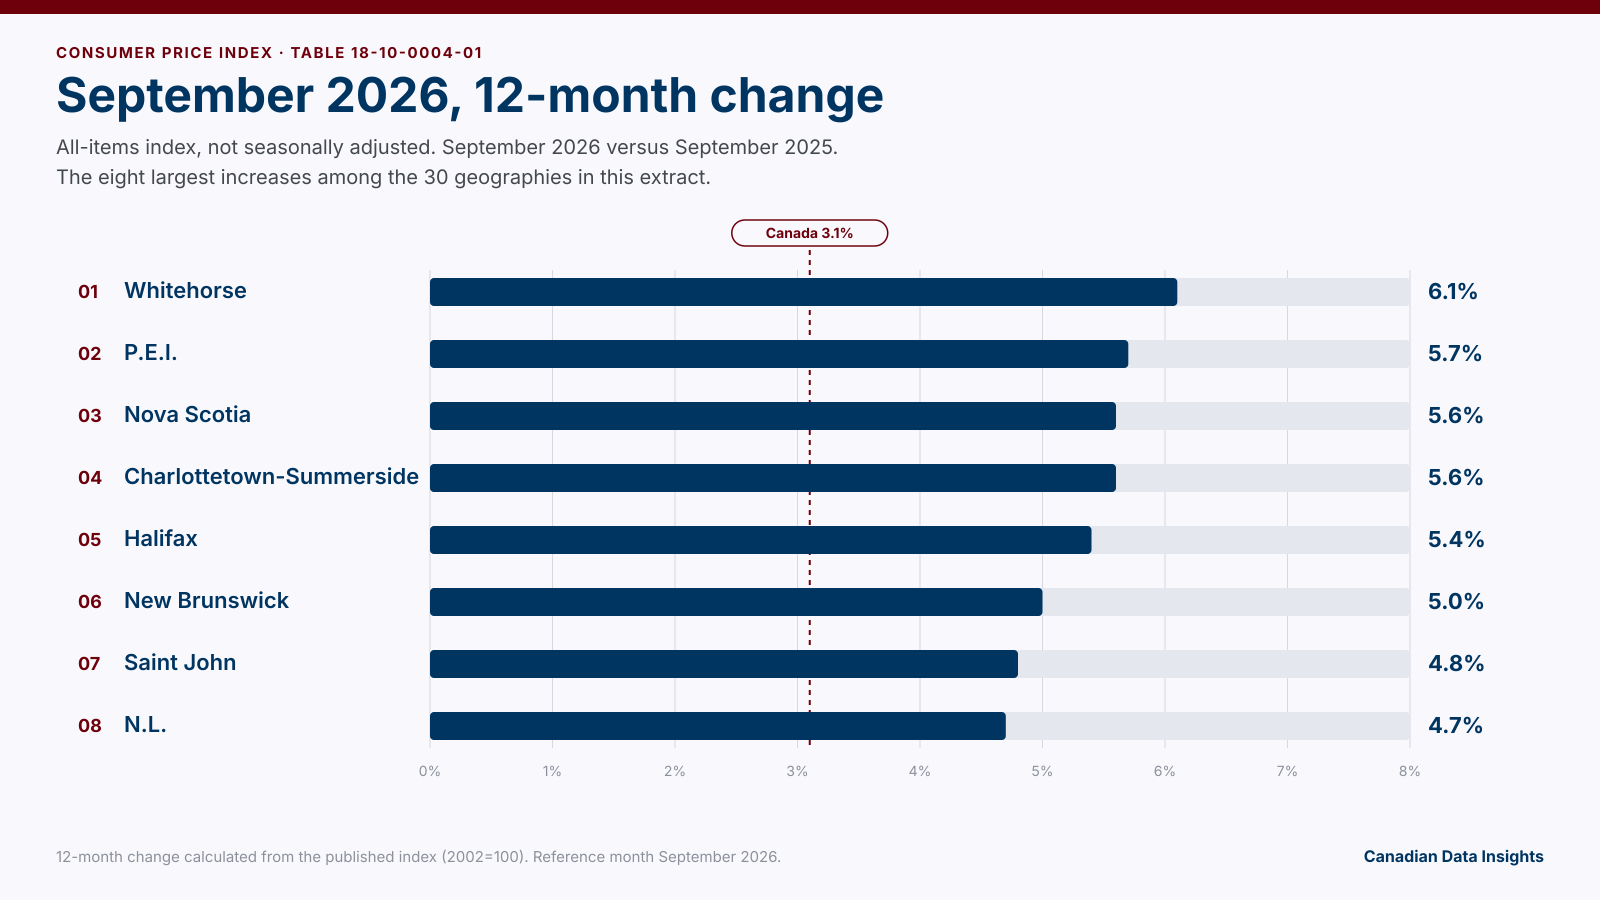
In September 2026, Canada’s all-items Consumer Price Index was 170.0 (2002=100), up 3.1% from 164.9 in September 2025. The 12-month change is calculated on this site from those two published index levels. It is not a separate Statistics Canada percent-change series. The food index was 201.8, up 2.2% from 197.5.
The source is table 18-10-0004-01, Consumer Price Index, monthly, not seasonally adjusted. The reference month is September 2026. The comparison month is September 2025. This extract has 30 geographies: Canada, the ten provinces, and 19 city or territorial price series. Yukon, the Northwest Territories, and Nunavut are not published here as territorial all-items indexes. Whitehorse, Yellowknife, and Iqaluit are. The figures were copied from the table on November 1, 2026. The full grid is on the cost-of-living page.
What the index measures
The index measures price change, with 2002 equal to 100. A higher index is not a higher dollar cost of living, and it is not the 12-month change. In this extract the highest all-items index is Calgary, Alberta, at 181.6. The lowest is Iqaluit, Nunavut, at 149.6. Calgary’s 12-month change is 3.4% (181.6 from 175.7). Iqaluit’s is 3.0% (149.6 from 145.2).
A city row follows Statistics Canada’s price-index geography, which is wider than a municipal boundary. Toronto, Ontario is the series published under that name. It is not the City of Toronto alone, and it is not Mississauga. It is also not Toronto (CMA), Ont., the 2021 Census geography in the shelter-cost post. Ottawa-Gatineau, Ontario part, Ontario/Quebec appears on the Ottawa page. Gatineau does not receive that series.
Charlottetown and Summerside, Prince Edward Island is one series. The Summerside page shows the same series. All 30 geographies rose from September 2025. Where two one-decimal changes match, the row above has the larger unrounded change, calculated from the two index levels.
All 30 geographies
Whitehorse, Yukon had the largest 12-month increase, 6.1% (174.4 from 164.4). Toronto, Ontario had the smallest, 2.1% (171.6 from 168.1). Ontario rose 2.5% (170.3 from 166.1). Prince Edward Island rose 5.7% (177.6 from 168.1). The Charlottetown and Summerside series rose 5.6% (178.5 from 169.1), just under the province. Nova Scotia also rounds to 5.6% (178.1 from 168.6), with a slightly larger unrounded change than Charlottetown and Summerside.
A dash means this extract has no food index for that geography. Food indexes are published for Canada, the ten provinces, Whitehorse, and Yellowknife. They are not published for the other city rows.
The food index
Where a food index is published for September 2026, every one of those 13 series rose from September 2025. Canada’s food index rose 2.2%, less than the all-items 3.1%. Whitehorse, Yukon had the largest food increase, 3.8% (175.4 from 168.9). New Brunswick had the smallest, 1.0% (212.8 from 210.6), against an all-items increase of 5.0%. Ontario’s food index rose 2.1% (204.1 from 199.9). That 2.1% is the food component for the province. Toronto’s 2.1% in the table above is the all-items change for the Toronto, Ontario series. Toronto has no food index in this extract.
Three food series round to 2.3%. On the unrounded change, Alberta (201.1 from 196.5) is ahead of Quebec (201.0 from 196.5), which is ahead of British Columbia (194.8 from 190.5).
Grocery prices in August 2026
Dollar prices are a different table, 18-10-0245-01, monthly average retail prices for selected products. In this extract every Canada price below is for August 2026, one month before the CPI reference month. The file has no year-ago price, so this post does not calculate a 12-month change for these products. The provincial comparison is on the cost-of-living page.
| Product | Month | Canada |
|---|---|---|
| Ground beef, per kilogram | August 2026 | $16.75 |
| Whole chicken, per kilogram | August 2026 | $7.13 |
| Chicken breasts, per kilogram | August 2026 | $14.41 |
| Milk, 2 litres | August 2026 | $5.49 |
| Eggs, 1 dozen | August 2026 | $4.83 |
| White bread, 675 grams | August 2026 | $3.63 |
| Butter, 454 grams | August 2026 | $5.68 |
| Apples, per kilogram | August 2026 | $6.47 |
| Bananas, per kilogram | August 2026 | $1.89 |
| Potatoes, per kilogram | August 2026 | $5.17 |
| Tomatoes, per kilogram | August 2026 | $4.80 |
| White rice, 2 kilograms | August 2026 | $9.73 |
| Dry or fresh pasta, 500 grams | August 2026 | $3.37 |
| Roasted or ground coffee, 340 grams | August 2026 | $9.46 |
Among the geographies that publish these four products, all of them for August 2026, the high and low prices are: ground beef, $18.53 in British Columbia and $15.75 in Prince Edward Island; milk, $5.92 in Ontario and $4.73 in Prince Edward Island; eggs, $5.71 in British Columbia and $4.16 in Quebec; white bread, $4.38 in Yellowknife, Northwest Territories and $3.27 in Ontario.
Shelter costs are a different table
The cost-of-living page also shows 2021 Census shelter costs for Canada. Those counts are tables 98-10-0252-01 and 98-10-0253-01, reference period 2021. They are not part of the September 2026 price index. Median shelter cost, owner share, and the share of households spending 30% or more of income on shelter are in Who owns, who rents, and where shelter takes 30% of income. Canada’s housing block is on the Canada page.
Sources
All-items and food indexes are from Statistics Canada table 18-10-0004-01, reference month September 2026, compared with September 2025. The index base is 2002=100. The 12-month percent change is calculated here from the published index levels. Average retail prices are from table 18-10-0245-01, August 2026. The extract was taken on November 1, 2026. See how this site handles these tables. Statistics Canada data is used under the Open Government Licence – Canada. Adapted from Statistics Canada, tables 18-10-0004-01 and 18-10-0245-01. This does not constitute an endorsement by Statistics Canada of this product. This post is by Andrew.
All-items CPI, 12-month change, September 2026 (percent)
Source: Statistics Canada, 2021 Census of Population
Data source → Census methodology & attribution
Back to All Insights